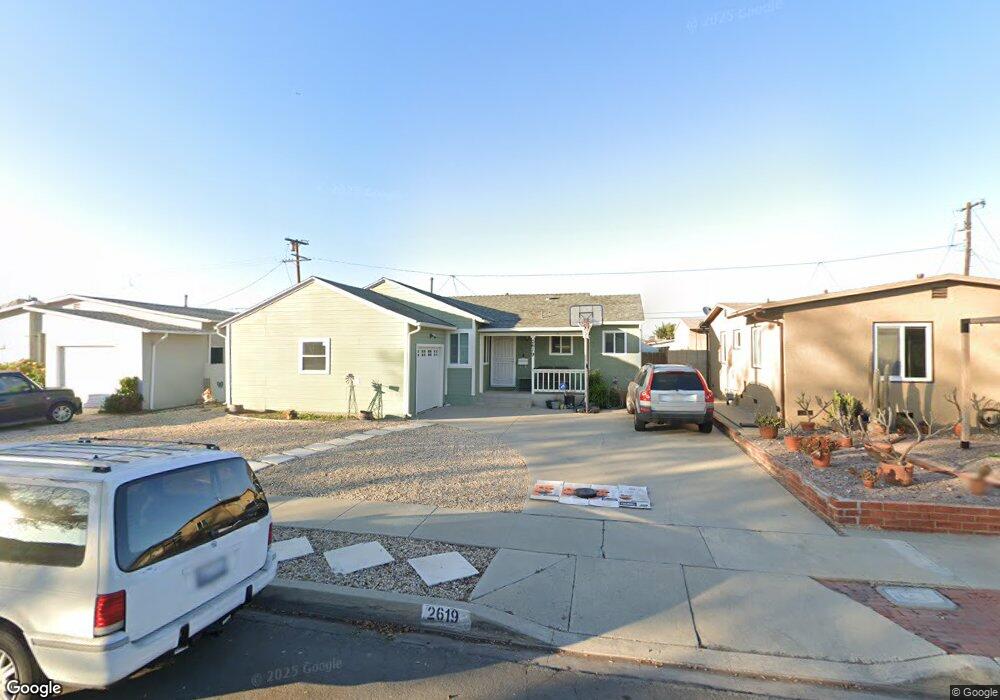
2619 W 175th St Torrance, CA 90504
North Torrance NeighborhoodEstimated Value: $834,000 - $1,025,000
3
Beds
1
Bath
1,023
Sq Ft
$880/Sq Ft
Est. Value
About This Home
This home is located at 2619 W 175th St, Torrance, CA 90504 and is currently estimated at $899,932, approximately $879 per square foot. 2619 W 175th St is a home located in Los Angeles County with nearby schools including Arlington Elementary School, Casimir Middle School, and North High School.
Ownership History
Date
Name
Owned For
Owner Type
Purchase Details
Closed on
Sep 1, 2015
Sold by
Merced David
Bought by
The Merced Caparino Living Trust
Current Estimated Value
Purchase Details
Closed on
Nov 12, 2002
Sold by
Caparino Melody
Bought by
Merced David and Caparino Melody
Purchase Details
Closed on
Mar 20, 2000
Sold by
Merced David
Bought by
Caparino Melody
Home Financials for this Owner
Home Financials are based on the most recent Mortgage that was taken out on this home.
Original Mortgage
$156,000
Outstanding Balance
$53,213
Interest Rate
8.38%
Estimated Equity
$846,720
Purchase Details
Closed on
Feb 25, 2000
Sold by
Family Trust Easton, Jack And Betsy Ruth Trs
Bought by
Merced David and Caparino Melody
Home Financials for this Owner
Home Financials are based on the most recent Mortgage that was taken out on this home.
Original Mortgage
$156,000
Outstanding Balance
$53,213
Interest Rate
8.38%
Estimated Equity
$846,720
Purchase Details
Closed on
Feb 26, 1998
Sold by
Hanson Betsy R
Bought by
Easton Jack H and Easton Betsy Ruth
Create a Home Valuation Report for This Property
The Home Valuation Report is an in-depth analysis detailing your home's value as well as a comparison with similar homes in the area
Home Values in the Area
Average Home Value in this Area
Purchase History
| Date | Buyer | Sale Price | Title Company |
|---|---|---|---|
| The Merced Caparino Living Trust | -- | None Available | |
| Merced David | -- | Lawyers Title Company | |
| Caparino Melody | -- | Progressive Title Company | |
| Merced David | $195,000 | Progressive Title Company | |
| Easton Jack H | -- | -- |
Source: Public Records
Mortgage History
| Date | Status | Borrower | Loan Amount |
|---|---|---|---|
| Open | Merced David | $156,000 |
Source: Public Records
Tax History Compared to Growth
Tax History
| Year | Tax Paid | Tax Assessment Tax Assessment Total Assessment is a certain percentage of the fair market value that is determined by local assessors to be the total taxable value of land and additions on the property. | Land | Improvement |
|---|---|---|---|---|
| 2025 | $3,683 | $299,683 | $239,755 | $59,928 |
| 2024 | $3,683 | $293,807 | $235,054 | $58,753 |
| 2023 | $3,620 | $288,047 | $230,446 | $57,601 |
| 2022 | $3,573 | $282,400 | $225,928 | $56,472 |
| 2021 | $3,505 | $276,864 | $221,499 | $55,365 |
| 2019 | $3,408 | $268,654 | $214,930 | $53,724 |
| 2018 | $3,228 | $263,387 | $210,716 | $52,671 |
| 2016 | $3,082 | $253,162 | $202,535 | $50,627 |
| 2015 | $3,015 | $249,360 | $199,493 | $49,867 |
| 2014 | $2,945 | $244,477 | $195,586 | $48,891 |
Source: Public Records
Map
Nearby Homes
- 17234 Ardath Ave
- 2527 Artesia Blvd Unit 67
- 2406 W 177th St
- 17508 Van Ness Ave
- 17033 Glenburn Ave
- 16725 Elgar Ave
- 17302 Ermanita Ave
- 3151 W 182nd St
- 2818 W 166th St
- 2321 W 184th St
- 16626 Haas Ave
- 18249 Van Ness Ave
- 18403 Eriel Ave
- 2007 W 180th Place
- 3482 W 171st St Unit 19
- 18405 Delia Ave
- 1900 Artesia Blvd Unit 63
- 1900 Artesia Blvd Unit 4
- 3349 W 183rd St
- 18505 Van Ness Ave
- 2611 W 175th St
- 2627 W 175th St
- 2635 W 175th St
- 2603 W 175th St
- 2720 Artesia Blvd
- 2712 Artesia Blvd
- 2728 Artesia Blvd
- 2620 W 175th St
- 2643 W 175th St
- 2704 Artesia Blvd
- 2628 W 175th St
- 2612 W 175th St
- 2636 W 175th St
- 2604 W 175th St
- 2744 Artesia Blvd
- 2703 W 175th St
- 2644 W 175th St
- 2804 Artesia Blvd
- 17519 Kristin Ave
- 2619 W 176th St