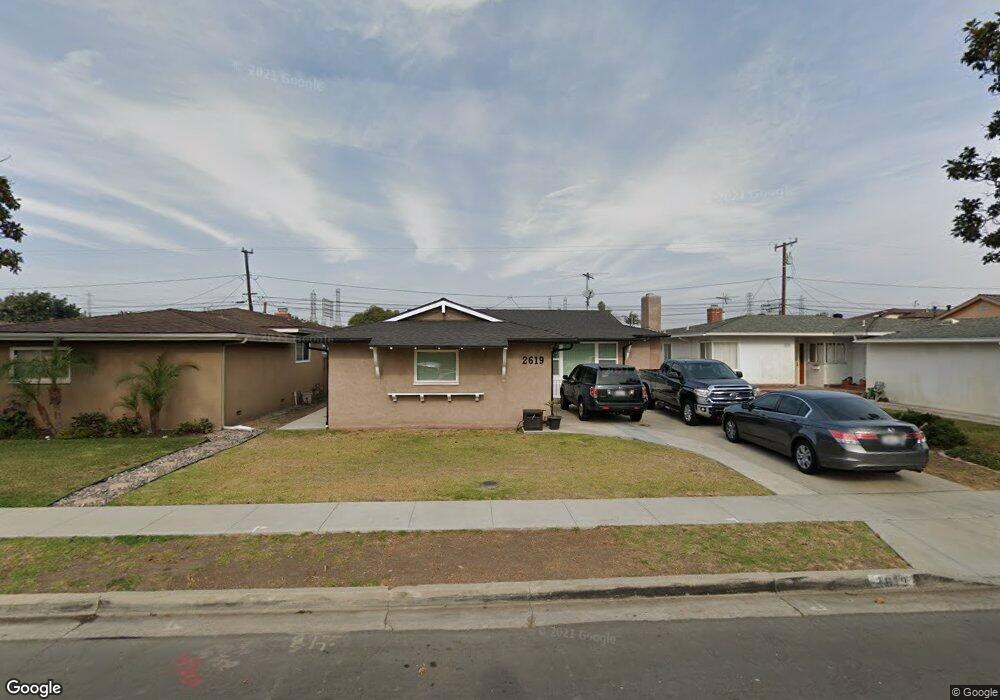
2619 W 180th St Torrance, CA 90504
North Torrance NeighborhoodEstimated Value: $935,000 - $1,105,000
3
Beds
2
Baths
1,473
Sq Ft
$695/Sq Ft
Est. Value
About This Home
This home is located at 2619 W 180th St, Torrance, CA 90504 and is currently estimated at $1,023,892, approximately $695 per square foot. 2619 W 180th St is a home located in Los Angeles County with nearby schools including Arlington Elementary School, Casimir Middle School, and North High School.
Ownership History
Date
Name
Owned For
Owner Type
Purchase Details
Closed on
Dec 3, 2019
Sold by
Rubalcava Russell and Rubalcava Jodyann N
Bought by
Rubalcava Russell P and Rubalcava Jodyann N
Current Estimated Value
Home Financials for this Owner
Home Financials are based on the most recent Mortgage that was taken out on this home.
Original Mortgage
$394,800
Outstanding Balance
$348,753
Interest Rate
3.7%
Mortgage Type
New Conventional
Estimated Equity
$675,139
Purchase Details
Closed on
Jun 28, 2017
Sold by
Rubalcava Russell P
Bought by
Rubalcava Russell P and Rubalcova Jodyann N
Purchase Details
Closed on
Mar 12, 2001
Sold by
Murray Pauline Olivia
Bought by
Rubalcava Russell P and Rubalcava Jodyann N
Home Financials for this Owner
Home Financials are based on the most recent Mortgage that was taken out on this home.
Original Mortgage
$227,200
Interest Rate
6.98%
Purchase Details
Closed on
Aug 24, 1998
Sold by
Murray Jack A
Bought by
Murray Jack Adams and Murray Pauline Olivia
Create a Home Valuation Report for This Property
The Home Valuation Report is an in-depth analysis detailing your home's value as well as a comparison with similar homes in the area
Home Values in the Area
Average Home Value in this Area
Purchase History
| Date | Buyer | Sale Price | Title Company |
|---|---|---|---|
| Rubalcava Russell P | -- | Pacific Coast Title Company | |
| Rubalcava Russell | -- | Pacific Coast Title Company | |
| Rubalcava Russell P | -- | None Available | |
| Rubalcava Russell P | $284,000 | North American Title | |
| Murray Jack Adams | -- | -- |
Source: Public Records
Mortgage History
| Date | Status | Borrower | Loan Amount |
|---|---|---|---|
| Open | Rubalcava Russell | $394,800 | |
| Closed | Rubalcava Russell P | $227,200 |
Source: Public Records
Tax History Compared to Growth
Tax History
| Year | Tax Paid | Tax Assessment Tax Assessment Total Assessment is a certain percentage of the fair market value that is determined by local assessors to be the total taxable value of land and additions on the property. | Land | Improvement |
|---|---|---|---|---|
| 2025 | $5,155 | $442,968 | $342,343 | $100,625 |
| 2024 | $5,155 | $434,283 | $335,631 | $98,652 |
| 2023 | $5,062 | $425,768 | $329,050 | $96,718 |
| 2022 | $4,993 | $417,421 | $322,599 | $94,822 |
| 2021 | $4,897 | $409,237 | $316,274 | $92,963 |
| 2019 | $4,756 | $397,100 | $306,894 | $90,206 |
| 2018 | $4,585 | $389,315 | $300,877 | $88,438 |
| 2016 | $4,373 | $374,199 | $289,195 | $85,004 |
| 2015 | $4,277 | $368,580 | $284,852 | $83,728 |
| 2014 | $4,171 | $361,361 | $279,273 | $82,088 |
Source: Public Records
Map
Nearby Homes
- 2406 W 177th St
- 2321 W 184th St
- 18249 Van Ness Ave
- 3151 W 182nd St
- 2527 Artesia Blvd Unit 67
- 17508 Van Ness Ave
- 17234 Ardath Ave
- 18505 Van Ness Ave
- 18403 Eriel Ave
- 18405 Delia Ave
- 2007 W 180th Place
- 3349 W 183rd St
- 2025 Artesia Blvd Unit G
- 18309 Faysmith Ave
- 1883 W 182nd St
- 1900 Artesia Blvd Unit 4
- 1900 Artesia Blvd Unit 63
- 17302 Ermanita Ave
- 18901 Haas Ave
- 17033 Glenburn Ave
- 2603 W 180th St
- 2607 W 180th St
- 2611 W 180th St
- 17914 Casimir Ave
- 2602 W 179th St
- 2606 W 179th St
- 2518 W 179th St
- 2615 W 180th St
- 2610 W 179th St
- 2602 W 180th St
- 2606 W 180th St
- 2513 W 180th St
- 2514 W 179th St
- 2614 W 179th St
- 2610 W 180th St
- 2614 W 180th St
- 18002 Casimir Ave
- 2509 W 180th St
- 2618 W 179th St
- 2510 W 179th St