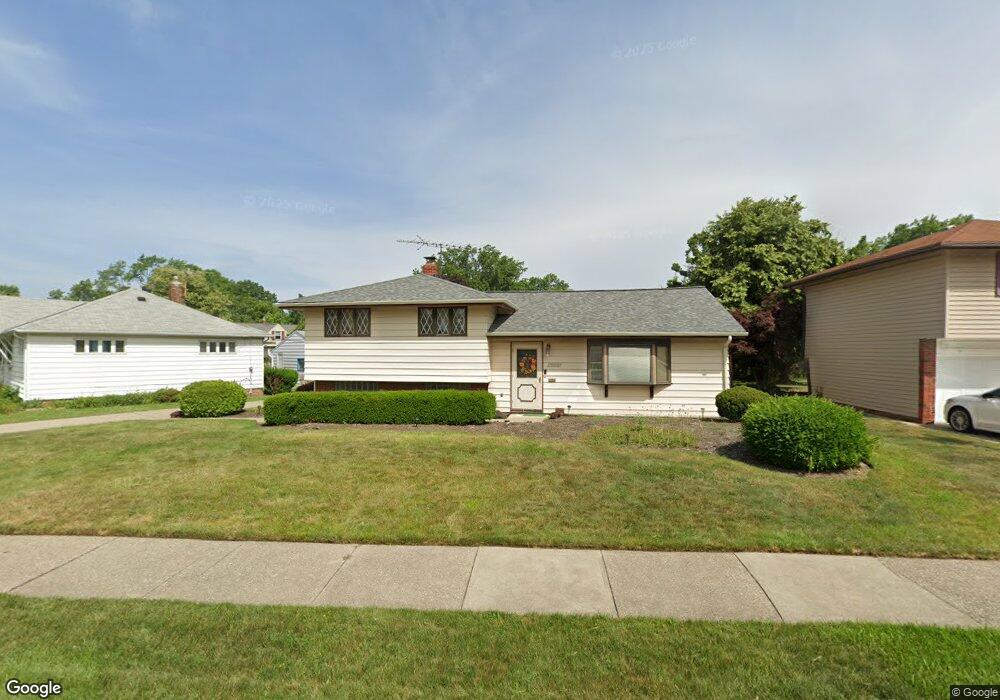
26193 Aaron Dr Euclid, OH 44132
Estimated Value: $163,000 - $196,000
3
Beds
2
Baths
1,832
Sq Ft
$100/Sq Ft
Est. Value
About This Home
This home is located at 26193 Aaron Dr, Euclid, OH 44132 and is currently estimated at $183,130, approximately $99 per square foot. 26193 Aaron Dr is a home located in Cuyahoga County with nearby schools including Shoreview Elementary School, Euclid High School, and Pinnacle Academy.
Ownership History
Date
Name
Owned For
Owner Type
Purchase Details
Closed on
Aug 19, 2005
Sold by
Zdesar Joseph M
Bought by
Mcclanahan Nicole M
Current Estimated Value
Home Financials for this Owner
Home Financials are based on the most recent Mortgage that was taken out on this home.
Original Mortgage
$25,900
Interest Rate
5.41%
Mortgage Type
Stand Alone Second
Purchase Details
Closed on
Jun 17, 2003
Sold by
Stevens Joseph J
Bought by
Zdesar Joseph M
Home Financials for this Owner
Home Financials are based on the most recent Mortgage that was taken out on this home.
Original Mortgage
$81,600
Interest Rate
5.71%
Mortgage Type
Purchase Money Mortgage
Purchase Details
Closed on
Feb 10, 2003
Sold by
Kuhar John F and Kuhar Julie
Bought by
Kuhar John F
Purchase Details
Closed on
Mar 22, 1985
Sold by
Kuhar John F
Bought by
Kuhar John F
Purchase Details
Closed on
Sep 15, 1978
Sold by
Schultz Carol
Bought by
Kuhar John F
Purchase Details
Closed on
Jan 1, 1975
Bought by
Schultz Carol
Create a Home Valuation Report for This Property
The Home Valuation Report is an in-depth analysis detailing your home's value as well as a comparison with similar homes in the area
Home Values in the Area
Average Home Value in this Area
Purchase History
| Date | Buyer | Sale Price | Title Company |
|---|---|---|---|
| Mcclanahan Nicole M | $129,500 | Truetitle Agency | |
| Zdesar Joseph M | $96,000 | Quality Title Agency Inc | |
| Kuhar John F | -- | -- | |
| Kuhar John F | -- | -- | |
| Kuhar John F | $67,500 | -- | |
| Schultz Carol | -- | -- |
Source: Public Records
Mortgage History
| Date | Status | Borrower | Loan Amount |
|---|---|---|---|
| Closed | Mcclanahan Nicole M | $25,900 | |
| Open | Mcclanahan Nicole M | $103,600 | |
| Previous Owner | Zdesar Joseph M | $81,600 |
Source: Public Records
Tax History
| Year | Tax Paid | Tax Assessment Tax Assessment Total Assessment is a certain percentage of the fair market value that is determined by local assessors to be the total taxable value of land and additions on the property. | Land | Improvement |
|---|---|---|---|---|
| 2024 | $4,014 | $58,905 | $10,290 | $48,615 |
| 2023 | $3,294 | $38,300 | $7,810 | $30,490 |
| 2022 | $3,218 | $38,290 | $7,810 | $30,490 |
| 2021 | $3,587 | $38,290 | $7,810 | $30,490 |
| 2020 | $3,400 | $33,010 | $6,720 | $26,290 |
| 2019 | $3,059 | $94,300 | $19,200 | $75,100 |
| 2018 | $3,040 | $33,010 | $6,720 | $26,290 |
| 2017 | $3,247 | $28,990 | $5,570 | $23,420 |
| 2016 | $3,254 | $28,990 | $5,570 | $23,420 |
| 2015 | $2,961 | $28,990 | $5,570 | $23,420 |
| 2014 | $2,961 | $28,990 | $5,570 | $23,420 |
Source: Public Records
Map
Nearby Homes
- 825 E 256th St
- 25650 Richards Ave
- 26430 Drakefield Ave
- 25700 Briardale Ave
- 643 E 261st St
- 25751 Briardale Ave
- 815 E 272nd St
- 579 E 260th St
- 26351 Farringdon Ave
- 571 E 260th St
- 25671 Farringdon Ave
- 890 E 250th St
- 27701 Mills Ave Unit 2G
- 25401 Farringdon Ave
- 515 E 250th St
- 24571 Alberton Rd
- 25731 Zeman Ave
- 24431 Hartland Rd
- 730 Hemlock Dr
- 610 E 266th St
Your Personal Tour Guide
Ask me questions while you tour the home.