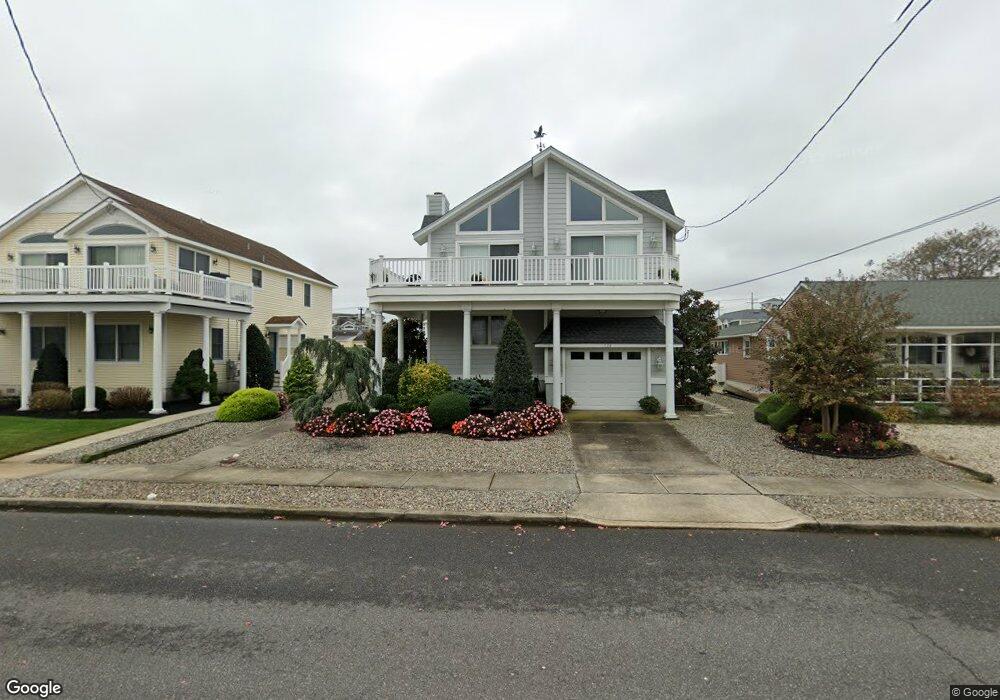
262 59th St Avalon, NJ 08202
Estimated Value: $3,633,181 - $4,763,000
Studio
--
Bath
2,675
Sq Ft
$1,550/Sq Ft
Est. Value
About This Home
This home is located at 262 59th St, Avalon, NJ 08202 and is currently estimated at $4,147,045, approximately $1,550 per square foot. 262 59th St is a home located in Cape May County with nearby schools including Avalon Elementary School.
Ownership History
Date
Name
Owned For
Owner Type
Purchase Details
Closed on
Aug 9, 2021
Sold by
Herrmann George D and Herrmann Diane A
Bought by
Herrmann George D
Current Estimated Value
Purchase Details
Closed on
Sep 18, 1990
Sold by
New Jersey Dep
Bought by
Herrmann George D and Herrmann Diane A
Purchase Details
Closed on
Mar 5, 1990
Sold by
Baker David
Bought by
Herrmann George and Herrmann Diane
Purchase Details
Closed on
Jan 30, 1990
Sold by
Mitrotz Albert and Mitrotz Dolores
Bought by
Baker David
Create a Home Valuation Report for This Property
The Home Valuation Report is an in-depth analysis detailing your home's value as well as a comparison with similar homes in the area
Home Values in the Area
Average Home Value in this Area
Purchase History
| Date | Buyer | Sale Price | Title Company |
|---|---|---|---|
| Herrmann George D | -- | None Available | |
| Herrmann George D | $22,100 | -- | |
| Herrmann George | $285,000 | -- | |
| Herrmann George D | $285,000 | -- | |
| Baker David | -- | -- |
Source: Public Records
Tax History
| Year | Tax Paid | Tax Assessment Tax Assessment Total Assessment is a certain percentage of the fair market value that is determined by local assessors to be the total taxable value of land and additions on the property. | Land | Improvement |
|---|---|---|---|---|
| 2025 | $11,589 | $1,887,400 | $1,400,000 | $487,400 |
| 2024 | $11,589 | $1,887,400 | $1,400,000 | $487,400 |
| 2023 | $11,494 | $1,887,400 | $1,400,000 | $487,400 |
| 2022 | $10,720 | $1,887,400 | $1,400,000 | $487,400 |
| 2021 | $10,324 | $1,887,400 | $1,400,000 | $487,400 |
| 2020 | $9,928 | $1,887,400 | $1,400,000 | $487,400 |
| 2019 | $9,626 | $1,887,400 | $1,400,000 | $487,400 |
| 2018 | $9,211 | $1,887,400 | $1,400,000 | $487,400 |
| 2017 | $8,303 | $1,493,300 | $1,000,000 | $493,300 |
| 2016 | $8,213 | $1,493,300 | $1,000,000 | $493,300 |
| 2015 | $8,079 | $1,493,300 | $1,000,000 | $493,300 |
| 2014 | $7,989 | $1,493,300 | $1,000,000 | $493,300 |
Source: Public Records
Map
Nearby Homes
- 5765 Ocean Dr
- 6229 Dune Dr
- 5499 Dune Dr
- 150 64th St
- 182 65th St
- 6762 Ocean Dr Unit 6762
- 6772 Ocean Dr Unit 6772
- 4640 Ocean Dr
- 177 71st St
- 4610 4th Ave
- 7463 Ocean Dr
- 256 42nd St
- 264 41st St
- 4040 Dune Dr
- 198 40th St
- 360 39th St Unit East
- 7800 Dune Dr Unit C205
- 315 79th St Unit 315
- 7888 Dune Dr Unit 218
- 280 79th St Unit 1
Your Personal Tour Guide
Ask me questions while you tour the home.