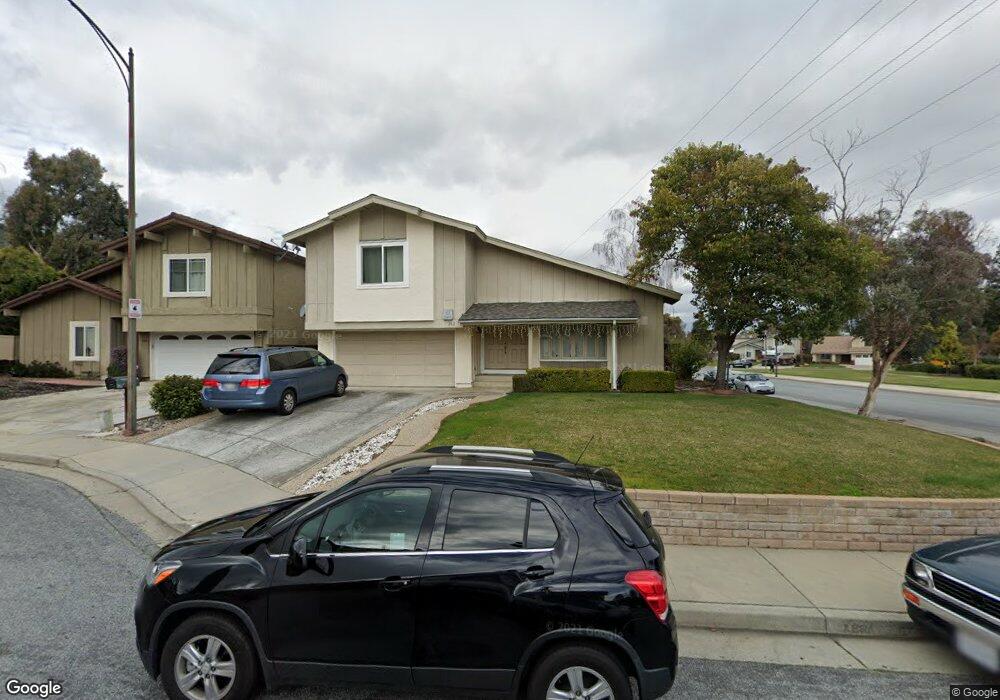
262 Abra Ct San Jose, CA 95139
Avenida Espana NeighborhoodEstimated Value: $1,436,765 - $1,627,000
4
Beds
3
Baths
2,137
Sq Ft
$724/Sq Ft
Est. Value
About This Home
This home is located at 262 Abra Ct, San Jose, CA 95139 and is currently estimated at $1,547,941, approximately $724 per square foot. 262 Abra Ct is a home located in Santa Clara County with nearby schools including Los Paseos Elementary School, Martin Murphy Middle School, and Ann Sobrato High School.
Ownership History
Date
Name
Owned For
Owner Type
Purchase Details
Closed on
Aug 6, 2008
Sold by
Murphy Roy F
Bought by
Pham Alan T and Nguyen Loan
Current Estimated Value
Home Financials for this Owner
Home Financials are based on the most recent Mortgage that was taken out on this home.
Original Mortgage
$100,000
Outstanding Balance
$65,922
Interest Rate
6.42%
Mortgage Type
Credit Line Revolving
Estimated Equity
$1,482,019
Purchase Details
Closed on
May 9, 2002
Sold by
Jones Rick Lee and Jones Elaine Mcgovern
Bought by
Murphy Roy F
Home Financials for this Owner
Home Financials are based on the most recent Mortgage that was taken out on this home.
Original Mortgage
$360,000
Interest Rate
6.94%
Purchase Details
Closed on
Feb 15, 1994
Sold by
Ries William A and Ries Karen M
Bought by
Jones Ricky Lee and Jones Elaine Mcgovern
Home Financials for this Owner
Home Financials are based on the most recent Mortgage that was taken out on this home.
Original Mortgage
$209,600
Interest Rate
6.98%
Create a Home Valuation Report for This Property
The Home Valuation Report is an in-depth analysis detailing your home's value as well as a comparison with similar homes in the area
Home Values in the Area
Average Home Value in this Area
Purchase History
| Date | Buyer | Sale Price | Title Company |
|---|---|---|---|
| Pham Alan T | $654,000 | Chicago Title Co | |
| Murphy Roy F | $577,500 | Old Republic Title Company | |
| Jones Ricky Lee | $262,000 | North American Title Co Inc |
Source: Public Records
Mortgage History
| Date | Status | Borrower | Loan Amount |
|---|---|---|---|
| Open | Pham Alan T | $100,000 | |
| Open | Pham Alan T | $417,000 | |
| Previous Owner | Murphy Roy F | $360,000 | |
| Previous Owner | Jones Ricky Lee | $209,600 |
Source: Public Records
Tax History Compared to Growth
Tax History
| Year | Tax Paid | Tax Assessment Tax Assessment Total Assessment is a certain percentage of the fair market value that is determined by local assessors to be the total taxable value of land and additions on the property. | Land | Improvement |
|---|---|---|---|---|
| 2025 | $10,938 | $842,182 | $505,311 | $336,871 |
| 2024 | $10,938 | $825,669 | $495,403 | $330,266 |
| 2023 | $10,745 | $809,481 | $485,690 | $323,791 |
| 2022 | $10,593 | $793,610 | $476,167 | $317,443 |
| 2021 | $10,280 | $778,050 | $466,831 | $311,219 |
| 2020 | $9,954 | $770,073 | $462,045 | $308,028 |
| 2019 | $10,178 | $754,975 | $452,986 | $301,989 |
| 2018 | $10,122 | $740,172 | $444,104 | $296,068 |
| 2017 | $10,020 | $725,660 | $435,397 | $290,263 |
| 2016 | $9,424 | $711,432 | $426,860 | $284,572 |
| 2015 | $9,312 | $700,747 | $420,449 | $280,298 |
| 2014 | $8,560 | $646,000 | $387,600 | $258,400 |
Source: Public Records
Map
Nearby Homes
- 202 French Ct
- 7270 Alder Spring Way
- 133 Cheltenham Way
- 7392 Tulare Hill Dr
- 219 Fairway Glen Ln
- 82 Essendon Way
- 45 Cheltenham Way
- 207 New River Dr
- 227 Martinvale Ln
- 237 Arbor Valley Dr
- 321 Vineyard Dr
- 6978 Gregorich Dr Unit F
- 6986 Gregorich Dr Unit C
- 6958 Gregorich Dr Unit G
- 22649 Country View Ct
- 201 Bahia Ct
- 7237 Longhill Way
- 6130 Monterey Rd Unit 201
- 6130 Monterey Rd Unit 289
- 6130 Monterey Rd Unit 9