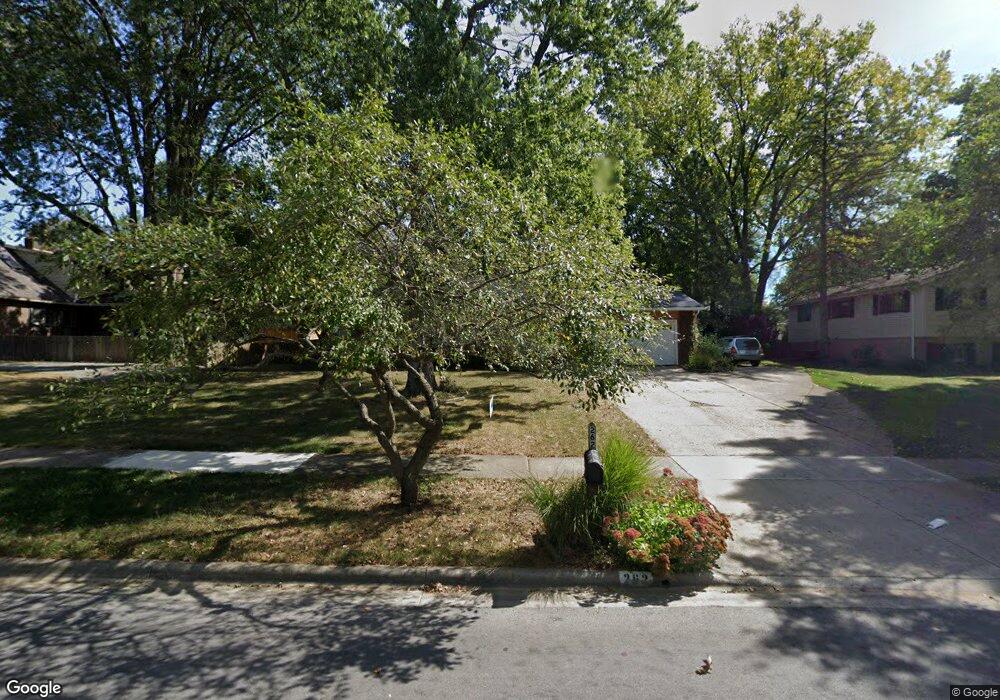
262 Apache St Westerville, OH 43081
Estimated Value: $428,000 - $451,000
4
Beds
3
Baths
2,360
Sq Ft
$187/Sq Ft
Est. Value
About This Home
This home is located at 262 Apache St, Westerville, OH 43081 and is currently estimated at $440,985, approximately $186 per square foot. 262 Apache St is a home located in Franklin County with nearby schools including Cherrington Elementary School, Blendon Middle School, and Westerville South High School.
Ownership History
Date
Name
Owned For
Owner Type
Purchase Details
Closed on
Feb 17, 2001
Sold by
Jenkins Timothy D and Jenkins Karen M
Bought by
Pansing Janet L and Varhola Irene F
Current Estimated Value
Home Financials for this Owner
Home Financials are based on the most recent Mortgage that was taken out on this home.
Original Mortgage
$132,400
Outstanding Balance
$45,726
Interest Rate
7.18%
Estimated Equity
$395,259
Purchase Details
Closed on
Aug 1, 1988
Bought by
Jenkins Timothy D
Create a Home Valuation Report for This Property
The Home Valuation Report is an in-depth analysis detailing your home's value as well as a comparison with similar homes in the area
Home Values in the Area
Average Home Value in this Area
Purchase History
| Date | Buyer | Sale Price | Title Company |
|---|---|---|---|
| Pansing Janet L | $166,200 | -- | |
| Jenkins Timothy D | $112,000 | -- |
Source: Public Records
Mortgage History
| Date | Status | Borrower | Loan Amount |
|---|---|---|---|
| Open | Pansing Janet L | $132,400 |
Source: Public Records
Tax History
| Year | Tax Paid | Tax Assessment Tax Assessment Total Assessment is a certain percentage of the fair market value that is determined by local assessors to be the total taxable value of land and additions on the property. | Land | Improvement |
|---|---|---|---|---|
| 2025 | $7,718 | $135,810 | $35,950 | $99,860 |
| 2024 | $7,718 | $135,810 | $35,950 | $99,860 |
| 2023 | $7,555 | $135,800 | $35,945 | $99,855 |
| 2022 | $7,410 | $101,710 | $28,980 | $72,730 |
| 2021 | $7,472 | $101,710 | $28,980 | $72,730 |
| 2020 | $7,451 | $101,710 | $28,980 | $72,730 |
| 2019 | $6,252 | $80,570 | $28,980 | $51,590 |
| 2018 | $5,701 | $80,570 | $28,980 | $51,590 |
| 2017 | $6,149 | $80,570 | $28,980 | $51,590 |
| 2016 | $5,444 | $64,930 | $22,860 | $42,070 |
| 2015 | $5,272 | $64,930 | $22,860 | $42,070 |
| 2014 | $5,276 | $64,930 | $22,860 | $42,070 |
| 2013 | $2,635 | $64,925 | $22,855 | $42,070 |
Source: Public Records
Map
Nearby Homes
- 215 Mainsail Dr
- 655 Mohican Way
- 487 Beachside Dr
- 687 E College Ave
- 291 Mohawk Ave
- 392 Hickory Ln
- 961 E College Ave
- 629 Andrew Ave
- 138 Wood St
- 45 Kanpur Place
- 612 E Schrock Rd
- 133 Illinois Ave
- 636 E Schrock Rd
- 559 Allview Ct
- 852 Karen Ct
- 703 Pointview Dr
- 613 Deer Run Rd
- 868 Liverpool Place
- 130 Fairdale Ave
- 328 Myrtle Dr Unit Lot 5
Your Personal Tour Guide
Ask me questions while you tour the home.