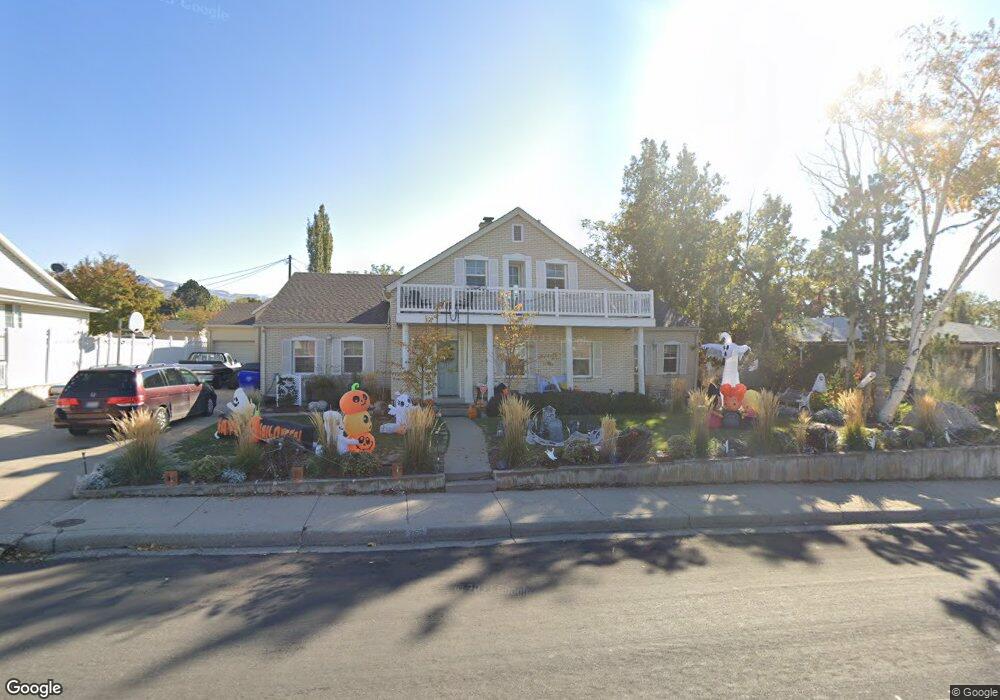
262 E Center St Bountiful, UT 84010
Estimated Value: $742,000 - $811,750
4
Beds
4
Baths
4,375
Sq Ft
$177/Sq Ft
Est. Value
About This Home
This home is located at 262 E Center St, Bountiful, UT 84010 and is currently estimated at $775,938, approximately $177 per square foot. 262 E Center St is a home located in Davis County with nearby schools including Holbrook Elementary School, Millcreek Junior High School, and Bountiful High School.
Ownership History
Date
Name
Owned For
Owner Type
Purchase Details
Closed on
Apr 17, 2020
Sold by
Fluhman J Roger J and Fluhman Suzanne H
Bought by
Skelton Tiffany H and Skelton Bryan H
Current Estimated Value
Home Financials for this Owner
Home Financials are based on the most recent Mortgage that was taken out on this home.
Original Mortgage
$406,491
Outstanding Balance
$359,897
Interest Rate
3.37%
Mortgage Type
FHA
Estimated Equity
$416,041
Purchase Details
Closed on
Sep 9, 2002
Sold by
Fluhman John Roger and Fluhman Suzanne H
Bought by
Fluhman J Roger and Fluhman Suzanne H
Create a Home Valuation Report for This Property
The Home Valuation Report is an in-depth analysis detailing your home's value as well as a comparison with similar homes in the area
Purchase History
| Date | Buyer | Sale Price | Title Company |
|---|---|---|---|
| Skelton Tiffany H | -- | Backman Title Services | |
| Fluhman J Roger | -- | -- |
Source: Public Records
Mortgage History
| Date | Status | Borrower | Loan Amount |
|---|---|---|---|
| Open | Skelton Tiffany H | $406,491 |
Source: Public Records
Tax History
| Year | Tax Paid | Tax Assessment Tax Assessment Total Assessment is a certain percentage of the fair market value that is determined by local assessors to be the total taxable value of land and additions on the property. | Land | Improvement |
|---|---|---|---|---|
| 2025 | $4,239 | $384,450 | $158,488 | $225,962 |
| 2024 | $4,138 | $374,551 | $150,376 | $224,175 |
| 2023 | $4,102 | $675,000 | $268,400 | $406,600 |
| 2022 | $4,192 | $392,700 | $144,389 | $248,311 |
| 2021 | $3,841 | $552,000 | $190,037 | $361,963 |
| 2020 | $3,121 | $447,000 | $159,230 | $287,770 |
| 2019 | $3,111 | $435,000 | $148,498 | $286,502 |
| 2018 | $2,950 | $406,000 | $145,142 | $260,858 |
| 2016 | $2,750 | $206,140 | $65,918 | $140,222 |
| 2015 | $2,412 | $169,125 | $65,918 | $103,207 |
| 2014 | $2,518 | $182,616 | $65,918 | $116,698 |
| 2013 | -- | $151,038 | $47,307 | $103,731 |
Source: Public Records
Map
Nearby Homes
- 255 E 400 S
- 357 S 100 E
- 55 E 200 N Unit 2
- 49 E 200 N Unit 4
- 51 E 200 N Unit 3
- 41 E 200 N Unit 6
- 520 S Orchard Dr Unit 17
- 254 N Main St
- 256 N Main St
- 252 N Main St
- 456 E 500 S
- 275 E Peach Ln S
- 453 N 400 E Unit 7-D
- 32 W 400 S
- 545 S 100 E
- 34 W 400 S
- 323 Peach Ln
- 698 E 200 S
- 683 E 100 N
- 513 N 400 E Unit 14B
Your Personal Tour Guide
Ask me questions while you tour the home.