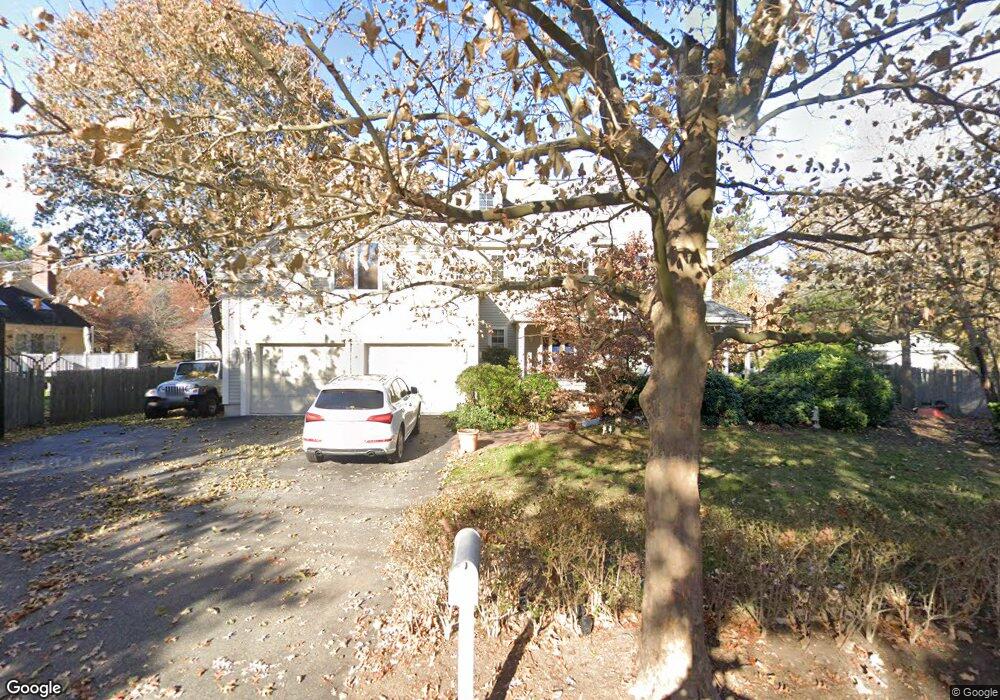
262 East St Lexington, MA 02420
Munroe Hill NeighborhoodEstimated Value: $1,910,908 - $2,450,000
5
Beds
4
Baths
3,442
Sq Ft
$643/Sq Ft
Est. Value
About This Home
This home is located at 262 East St, Lexington, MA 02420 and is currently estimated at $2,211,727, approximately $642 per square foot. 262 East St is a home located in Middlesex County with nearby schools including Fiske Elementary School, William Diamond Middle School, and Lexington High School.
Ownership History
Date
Name
Owned For
Owner Type
Purchase Details
Closed on
Jun 25, 1996
Sold by
Gregory Donald H
Bought by
Holbrook Jeanne M and Holbrook David
Current Estimated Value
Purchase Details
Closed on
Apr 23, 1993
Sold by
Temple Nellie M
Bought by
Gregory Donald H
Create a Home Valuation Report for This Property
The Home Valuation Report is an in-depth analysis detailing your home's value as well as a comparison with similar homes in the area
Home Values in the Area
Average Home Value in this Area
Purchase History
| Date | Buyer | Sale Price | Title Company |
|---|---|---|---|
| Holbrook Jeanne M | $220,000 | -- | |
| Gregory Donald H | $184,000 | -- |
Source: Public Records
Mortgage History
| Date | Status | Borrower | Loan Amount |
|---|---|---|---|
| Open | Gregory Donald H | $450,000 | |
| Closed | Gregory Donald H | $400,000 | |
| Closed | Gregory Donald H | $300,000 |
Source: Public Records
Tax History Compared to Growth
Tax History
| Year | Tax Paid | Tax Assessment Tax Assessment Total Assessment is a certain percentage of the fair market value that is determined by local assessors to be the total taxable value of land and additions on the property. | Land | Improvement |
|---|---|---|---|---|
| 2025 | $23,017 | $1,882,000 | $619,000 | $1,263,000 |
| 2024 | $22,160 | $1,809,000 | $590,000 | $1,219,000 |
| 2023 | $21,112 | $1,624,000 | $536,000 | $1,088,000 |
| 2022 | $20,396 | $1,478,000 | $487,000 | $991,000 |
| 2021 | $20,678 | $1,437,000 | $464,000 | $973,000 |
| 2020 | $19,010 | $1,353,000 | $464,000 | $889,000 |
| 2019 | $18,483 | $1,309,000 | $442,000 | $867,000 |
| 2018 | $13,097 | $1,284,000 | $496,000 | $788,000 |
| 2017 | $4,701 | $1,249,000 | $485,000 | $764,000 |
| 2016 | $17,695 | $1,212,000 | $442,000 | $770,000 |
| 2015 | $16,881 | $1,136,000 | $402,000 | $734,000 |
| 2014 | $15,277 | $985,000 | $299,000 | $686,000 |
Source: Public Records
Map
Nearby Homes