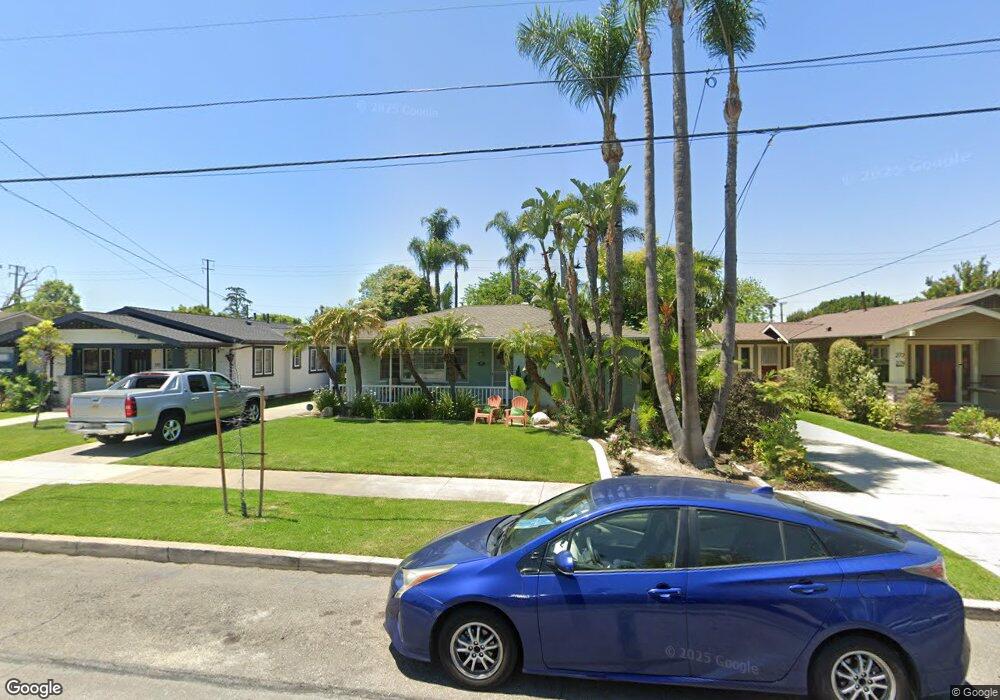
262 N Waverly St Orange, CA 92866
Estimated Value: $1,018,178 - $1,197,000
2
Beds
1
Bath
1,173
Sq Ft
$977/Sq Ft
Est. Value
About This Home
This home is located at 262 N Waverly St, Orange, CA 92866 and is currently estimated at $1,145,545, approximately $976 per square foot. 262 N Waverly St is a home located in Orange County with nearby schools including Cambridge Elementary School, Yorba Middle School, and Orange High School.
Ownership History
Date
Name
Owned For
Owner Type
Purchase Details
Closed on
Dec 23, 2002
Sold by
Beck George and Beck Paula
Bought by
Smith Steven R and Smith Georgiann
Current Estimated Value
Home Financials for this Owner
Home Financials are based on the most recent Mortgage that was taken out on this home.
Original Mortgage
$50,000
Interest Rate
5.83%
Purchase Details
Closed on
Oct 29, 1996
Sold by
Collins Alfred J
Bought by
Beck George and Beck Paula
Home Financials for this Owner
Home Financials are based on the most recent Mortgage that was taken out on this home.
Original Mortgage
$167,000
Interest Rate
8.06%
Purchase Details
Closed on
Feb 6, 1995
Sold by
Dooling William E and Dooling Judith F
Bought by
Beck George and Beck Paula
Home Financials for this Owner
Home Financials are based on the most recent Mortgage that was taken out on this home.
Original Mortgage
$163,800
Interest Rate
9.21%
Mortgage Type
Seller Take Back
Create a Home Valuation Report for This Property
The Home Valuation Report is an in-depth analysis detailing your home's value as well as a comparison with similar homes in the area
Home Values in the Area
Average Home Value in this Area
Purchase History
| Date | Buyer | Sale Price | Title Company |
|---|---|---|---|
| Smith Steven R | -- | -- | |
| Beck George | -- | Continental Lawyers Title Co | |
| Beck George | $182,000 | South Coast Title Company |
Source: Public Records
Mortgage History
| Date | Status | Borrower | Loan Amount |
|---|---|---|---|
| Closed | Smith Steven R | $50,000 | |
| Previous Owner | Beck George | $167,000 | |
| Previous Owner | Beck George | $163,800 |
Source: Public Records
Tax History Compared to Growth
Tax History
| Year | Tax Paid | Tax Assessment Tax Assessment Total Assessment is a certain percentage of the fair market value that is determined by local assessors to be the total taxable value of land and additions on the property. | Land | Improvement |
|---|---|---|---|---|
| 2025 | $6,540 | $593,082 | $509,796 | $83,286 |
| 2024 | $6,540 | $581,453 | $499,800 | $81,653 |
| 2023 | $6,395 | $570,052 | $490,000 | $80,052 |
| 2022 | $6,271 | $558,875 | $480,392 | $78,483 |
| 2021 | $6,097 | $547,917 | $470,972 | $76,945 |
| 2020 | $6,041 | $542,299 | $466,142 | $76,157 |
| 2019 | $5,965 | $531,666 | $457,002 | $74,664 |
| 2018 | $5,875 | $521,242 | $448,042 | $73,200 |
| 2017 | $5,632 | $511,022 | $439,257 | $71,765 |
| 2016 | $5,524 | $501,002 | $430,644 | $70,358 |
| 2015 | $5,443 | $493,477 | $424,175 | $69,302 |
| 2014 | $5,327 | $483,811 | $415,866 | $67,945 |
Source: Public Records
Map
Nearby Homes
- 181 N Monterey Rd
- 280 N Cleveland St
- 1514 E Palm Ave
- 1144 E Madison Ave
- 1331 E Century Dr
- 316 N Shattuck Place
- 445 N Center St
- 547 E Washington Ave
- 1916 1920 E Kirkwood
- 1105 E Rose Ave
- 528 E Palmyra Ave
- 315 E Washington Ave
- 1904 E Palm Ave
- 313 E Palmyra Ave
- 360 S Greengrove Dr
- 1040 E Oakmont Ave
- 415 N Wayfield St
- 337 E Everett Place
- 447 S Shaffer St
- 906 E Chalynn Ave
- 252 N Waverly St
- 272 N Waverly St
- 242 N Waverly St
- 282 N Waverly St
- 261 N Cambridge St
- 251 N Cambridge St
- 271 N Cambridge St
- 232 N Waverly St
- 292 N Waverly St
- 241 N Cambridge St
- 281 N Cambridge St
- 926 E Palm Ave
- 265 N Waverly St
- 255 N Waverly St
- 275 N Waverly St
- 1010 E Palm Ave
- 228 N Waverly St
- 291 N Cambridge St
- 225 N Cambridge St
- 1020 E Palm Ave