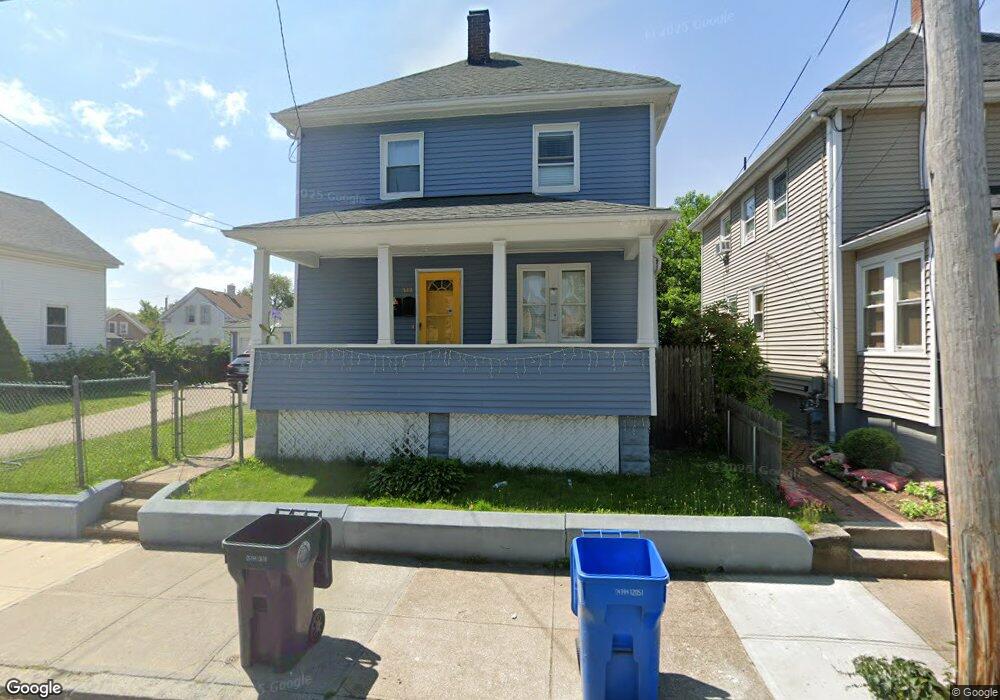
262 Northup St Cranston, RI 02905
Edgewood NeighborhoodEstimated Value: $368,000 - $384,500
3
Beds
2
Baths
1,232
Sq Ft
$305/Sq Ft
Est. Value
About This Home
This home is located at 262 Northup St, Cranston, RI 02905 and is currently estimated at $375,625, approximately $304 per square foot. 262 Northup St is a home located in Providence County with nearby schools including Edgewood Highland Elementary School, Park View Middle School, and Cranston High School East.
Ownership History
Date
Name
Owned For
Owner Type
Purchase Details
Closed on
Feb 15, 2007
Sold by
Maldonado Natalie and Maldonado Jose
Bought by
Perez Angelina and Perez Wilber
Current Estimated Value
Home Financials for this Owner
Home Financials are based on the most recent Mortgage that was taken out on this home.
Original Mortgage
$204,500
Outstanding Balance
$122,412
Interest Rate
6.24%
Mortgage Type
Purchase Money Mortgage
Estimated Equity
$253,213
Purchase Details
Closed on
Jan 3, 2003
Sold by
Johnson Stanley and Stanley Jo Anne
Bought by
Maldonado Jose and Maldonado Natalie
Home Financials for this Owner
Home Financials are based on the most recent Mortgage that was taken out on this home.
Original Mortgage
$115,481
Interest Rate
6.08%
Create a Home Valuation Report for This Property
The Home Valuation Report is an in-depth analysis detailing your home's value as well as a comparison with similar homes in the area
Home Values in the Area
Average Home Value in this Area
Purchase History
| Date | Buyer | Sale Price | Title Company |
|---|---|---|---|
| Perez Angelina | $205,000 | -- | |
| Maldonado Jose | $117,000 | -- |
Source: Public Records
Mortgage History
| Date | Status | Borrower | Loan Amount |
|---|---|---|---|
| Open | Maldonado Jose | $204,500 | |
| Previous Owner | Maldonado Jose | $29,000 | |
| Previous Owner | Maldonado Jose | $165,750 | |
| Previous Owner | Maldonado Jose | $115,481 |
Source: Public Records
Tax History Compared to Growth
Tax History
| Year | Tax Paid | Tax Assessment Tax Assessment Total Assessment is a certain percentage of the fair market value that is determined by local assessors to be the total taxable value of land and additions on the property. | Land | Improvement |
|---|---|---|---|---|
| 2025 | $4,210 | $303,300 | $99,600 | $203,700 |
| 2024 | $4,128 | $303,300 | $99,600 | $203,700 |
| 2023 | $3,650 | $193,100 | $43,700 | $149,400 |
| 2022 | $3,574 | $193,100 | $43,700 | $149,400 |
| 2021 | $3,476 | $193,100 | $43,700 | $149,400 |
| 2020 | $3,053 | $147,000 | $34,300 | $112,700 |
| 2019 | $3,053 | $147,000 | $34,300 | $112,700 |
| 2018 | $2,983 | $147,000 | $34,300 | $112,700 |
| 2017 | $2,340 | $102,000 | $15,600 | $86,400 |
| 2016 | $2,290 | $102,000 | $15,600 | $86,400 |
Source: Public Records
Map
Nearby Homes
- 243 Bay View Ave
- 303 Narragansett St
- 358 Northup St
- 274 Montgomery Ave
- 88 Wentworth Ave
- 67 Armington St
- 236 Vermont Ave
- 15 Wheeler Ave
- 208 California Ave
- 180 Ohio Ave
- 312 California Ave
- 160 Ohio Ave
- 255 Ohio Ave
- 218 Indiana Ave
- 114 Norwood Ave
- 115 Ohio Ave
- 171 Norwood Ave
- 37 Farragut Ave
- 61 Cyr St
- 305 Indiana Ave