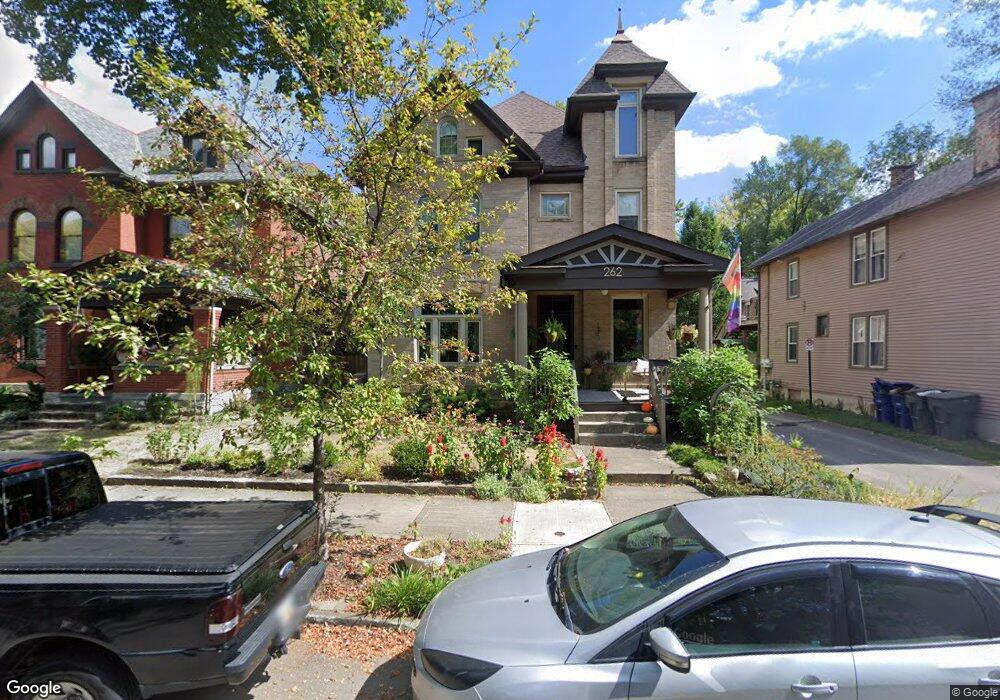
262 S 17th St Columbus, OH 43205
Olde Towne East NeighborhoodEstimated Value: $440,261 - $621,000
5
Beds
4
Baths
2,844
Sq Ft
$187/Sq Ft
Est. Value
About This Home
This home is located at 262 S 17th St, Columbus, OH 43205 and is currently estimated at $531,065, approximately $186 per square foot. 262 S 17th St is a home located in Franklin County with nearby schools including Ohio Avenue Elementary School, Champion Middle School, and East High School.
Ownership History
Date
Name
Owned For
Owner Type
Purchase Details
Closed on
Apr 9, 2019
Sold by
Fetters John L and Fetters Mary R
Bought by
Warnement Jeffrey H and Warnement Rebecca M
Current Estimated Value
Home Financials for this Owner
Home Financials are based on the most recent Mortgage that was taken out on this home.
Original Mortgage
$525,000
Outstanding Balance
$457,281
Interest Rate
4.25%
Mortgage Type
Adjustable Rate Mortgage/ARM
Estimated Equity
$73,784
Purchase Details
Closed on
Mar 23, 1989
Bought by
Fetters John L and Fetters Mary R
Purchase Details
Closed on
Jan 1, 1987
Purchase Details
Closed on
Apr 1, 1984
Create a Home Valuation Report for This Property
The Home Valuation Report is an in-depth analysis detailing your home's value as well as a comparison with similar homes in the area
Home Values in the Area
Average Home Value in this Area
Purchase History
| Date | Buyer | Sale Price | Title Company |
|---|---|---|---|
| Warnement Jeffrey H | $378,000 | None Available | |
| Fetters John L | $36,000 | -- | |
| -- | $16,000 | -- | |
| -- | $9,000 | -- |
Source: Public Records
Mortgage History
| Date | Status | Borrower | Loan Amount |
|---|---|---|---|
| Open | Warnement Jeffrey H | $525,000 |
Source: Public Records
Tax History
| Year | Tax Paid | Tax Assessment Tax Assessment Total Assessment is a certain percentage of the fair market value that is determined by local assessors to be the total taxable value of land and additions on the property. | Land | Improvement |
|---|---|---|---|---|
| 2025 | $5,375 | $119,770 | $22,960 | $96,810 |
| 2024 | $5,375 | $119,770 | $22,960 | $96,810 |
| 2023 | $5,307 | $119,770 | $22,960 | $96,810 |
| 2022 | $3,201 | $61,710 | $1,750 | $59,960 |
| 2021 | $3,206 | $61,710 | $1,750 | $59,960 |
| 2020 | $3,210 | $61,710 | $1,750 | $59,960 |
| 2019 | $3,199 | $51,450 | $1,470 | $49,980 |
| 2018 | $2,045 | $51,450 | $1,470 | $49,980 |
| 2017 | $2,589 | $51,450 | $1,470 | $49,980 |
| 2016 | $1,658 | $33,780 | $3,330 | $30,450 |
| 2015 | $1,505 | $33,780 | $3,330 | $30,450 |
| 2014 | $1,509 | $33,780 | $3,330 | $30,450 |
| 2013 | $797 | $35,560 | $3,500 | $32,060 |
Source: Public Records
Map
Nearby Homes
- 269 S 17th St
- 308 Carpenter St
- 891 E Mound St
- 192 S 19th St Unit 194
- 151 S 17th St Unit 151
- 947 Mcallister Ave
- 977 Bryden Rd
- 847 Franklin Ave
- 878 Franklin Ave
- 143 S Garfield Ave
- 270 S 21st St
- 1021 Bryden Rd
- 273 S 22nd St
- 865 Oak St Unit 863
- 100 S 17th St Unit 3
- 972 Franklin Ave
- 0 Carpenter St
- 452 Gilbert St
- 726 Franklin Ave
- 1042 Mcallister Ave Unit 44
- 258 S 17th St
- 270 S 17th St Unit 272
- 252 S 17th St
- 276 S 17th St
- 248 S 17th St
- 242 S 17th St
- 286 S 17th St Unit 288
- 277 S 18th St
- 261 S 17th St Unit 263
- 261 S 17th St Unit 2
- 255 S 17th St
- 259 S 18th St
- 249 S 17th St
- 265 S 18th St
- 234 S 17th St Unit 236
- 234-236 S 17th St
- 290 S 17th St
- 253 S 18th St
- 273 S 17th St
- 281 S 18th St
Your Personal Tour Guide
Ask me questions while you tour the home.