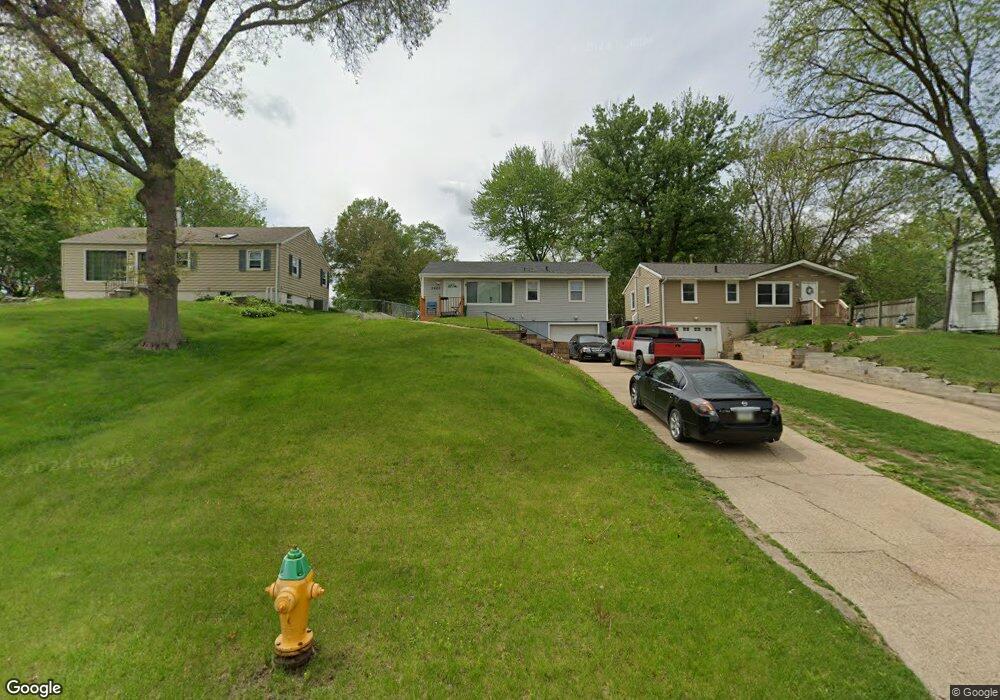
2620 56th St Des Moines, IA 50310
Merle Hay NeighborhoodEstimated Value: $200,000 - $209,000
3
Beds
1
Bath
840
Sq Ft
$243/Sq Ft
Est. Value
About This Home
This home is located at 2620 56th St, Des Moines, IA 50310 and is currently estimated at $204,405, approximately $243 per square foot. 2620 56th St is a home located in Polk County with nearby schools including Hillis Elementary School, Meredith Middle School, and Hoover High School.
Ownership History
Date
Name
Owned For
Owner Type
Purchase Details
Closed on
Oct 21, 2013
Sold by
Christensen Chad L and Christensen Bonnie J
Bought by
Jeteric Amir
Current Estimated Value
Home Financials for this Owner
Home Financials are based on the most recent Mortgage that was taken out on this home.
Original Mortgage
$99,170
Outstanding Balance
$75,236
Interest Rate
4.75%
Mortgage Type
FHA
Estimated Equity
$129,169
Purchase Details
Closed on
Aug 20, 2000
Sold by
Stork Ryan D and Stork Lisa M
Bought by
Christensen Chad L and Christensen Bonnie J
Home Financials for this Owner
Home Financials are based on the most recent Mortgage that was taken out on this home.
Original Mortgage
$97,900
Interest Rate
8.26%
Mortgage Type
VA
Purchase Details
Closed on
Apr 25, 1999
Sold by
Linebach Marsha Gail and Linebach Mark William
Bought by
Stork Ryan D and Stork Lisa M
Home Financials for this Owner
Home Financials are based on the most recent Mortgage that was taken out on this home.
Original Mortgage
$85,685
Interest Rate
7.17%
Mortgage Type
FHA
Create a Home Valuation Report for This Property
The Home Valuation Report is an in-depth analysis detailing your home's value as well as a comparison with similar homes in the area
Home Values in the Area
Average Home Value in this Area
Purchase History
| Date | Buyer | Sale Price | Title Company |
|---|---|---|---|
| Jeteric Amir | $101,000 | None Available | |
| Christensen Chad L | $95,500 | -- | |
| Stork Ryan D | $85,500 | -- |
Source: Public Records
Mortgage History
| Date | Status | Borrower | Loan Amount |
|---|---|---|---|
| Open | Jeteric Amir | $99,170 | |
| Previous Owner | Christensen Chad L | $97,900 | |
| Previous Owner | Stork Ryan D | $85,685 |
Source: Public Records
Tax History Compared to Growth
Tax History
| Year | Tax Paid | Tax Assessment Tax Assessment Total Assessment is a certain percentage of the fair market value that is determined by local assessors to be the total taxable value of land and additions on the property. | Land | Improvement |
|---|---|---|---|---|
| 2025 | $3,126 | $185,300 | $52,200 | $133,100 |
| 2024 | $3,126 | $169,400 | $47,100 | $122,300 |
| 2023 | $3,204 | $169,400 | $47,100 | $122,300 |
| 2022 | $3,178 | $144,800 | $41,000 | $103,800 |
| 2021 | $3,090 | $144,800 | $41,000 | $103,800 |
| 2020 | $3,204 | $132,400 | $37,400 | $95,000 |
| 2019 | $2,966 | $132,400 | $37,400 | $95,000 |
| 2018 | $2,932 | $118,900 | $32,900 | $86,000 |
| 2017 | $2,674 | $118,900 | $32,900 | $86,000 |
| 2016 | $2,600 | $107,400 | $29,400 | $78,000 |
| 2015 | $2,600 | $107,400 | $29,400 | $78,000 |
| 2014 | $2,766 | $108,000 | $29,000 | $79,000 |
Source: Public Records
Map
Nearby Homes