Estimated Value: $428,000 - $450,000
3
Beds
2
Baths
1,386
Sq Ft
$319/Sq Ft
Est. Value
About This Home
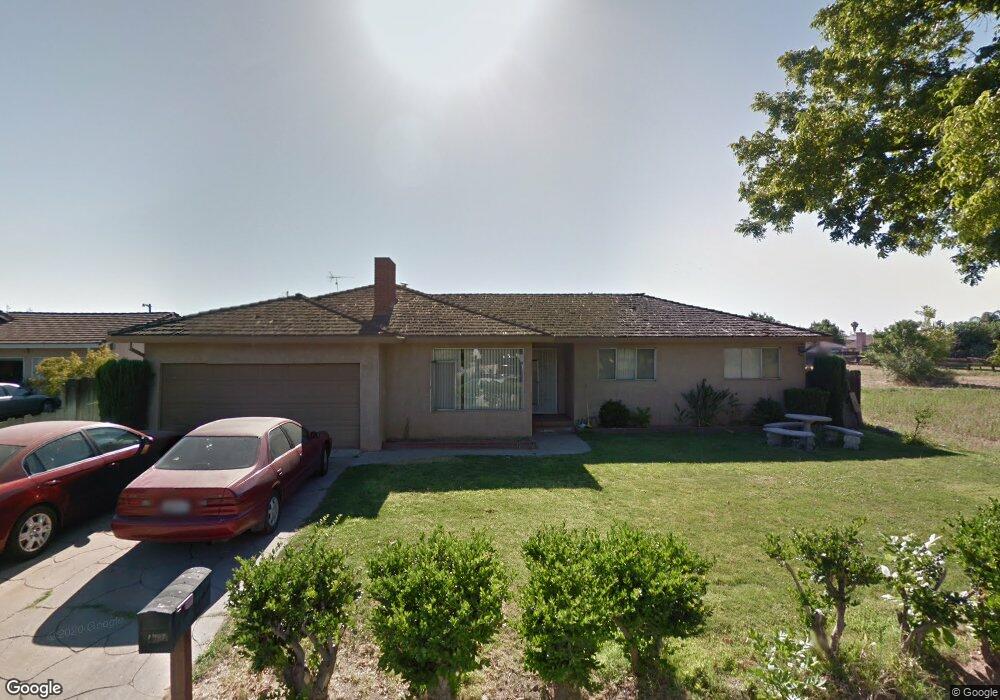
This home is located at 2620 Fiesta Way, Ceres, CA 95307 and is currently estimated at $441,730, approximately $318 per square foot. 2620 Fiesta Way is a home located in Stanislaus County with nearby schools including Sinclear Elementary School, Blaker-Kinser Junior High School, and Central Valley High School.
Ownership History
Date
Name
Owned For
Owner Type
Purchase Details
Closed on
Oct 7, 2024
Sold by
Turlock Irrigation District
Bought by
Turlock Irrigation District
Current Estimated Value
Purchase Details
Closed on
Sep 21, 2023
Sold by
Henriquez Jorge M and Henriquez Rachel
Bought by
Turlock Irrigation District
Purchase Details
Closed on
Sep 10, 2013
Sold by
Henriquez Jorge and Henriguez Ranchel
Bought by
Turlock Irrigation District
Purchase Details
Closed on
Nov 2, 1999
Sold by
Ott Walter C and Ott Beverly
Bought by
Martinez Henriquez Jorge M and Martinez Henriquez Rachel
Home Financials for this Owner
Home Financials are based on the most recent Mortgage that was taken out on this home.
Original Mortgage
$99,000
Interest Rate
7.68%
Create a Home Valuation Report for This Property
The Home Valuation Report is an in-depth analysis detailing your home's value as well as a comparison with similar homes in the area
Home Values in the Area
Average Home Value in this Area
Purchase History
| Date | Buyer | Sale Price | Title Company |
|---|---|---|---|
| Turlock Irrigation District | -- | -- | |
| Turlock Irrigation District | -- | -- | |
| Turlock Irrigation District | -- | None Available | |
| Martinez Henriquez Jorge M | $110,000 | Chicago Title Co |
Source: Public Records
Mortgage History
| Date | Status | Borrower | Loan Amount |
|---|---|---|---|
| Previous Owner | Martinez Henriquez Jorge M | $99,000 |
Source: Public Records
Tax History Compared to Growth
Tax History
| Year | Tax Paid | Tax Assessment Tax Assessment Total Assessment is a certain percentage of the fair market value that is determined by local assessors to be the total taxable value of land and additions on the property. | Land | Improvement |
|---|---|---|---|---|
| 2024 | $2,132 | $190,329 | $52,727 | $137,602 |
| 2023 | $2,075 | $186,598 | $51,694 | $134,904 |
| 2022 | $2,058 | $182,940 | $50,681 | $132,259 |
| 2021 | $2,039 | $179,354 | $49,688 | $129,666 |
| 2020 | $1,976 | $177,516 | $49,179 | $128,337 |
| 2019 | $1,963 | $174,036 | $48,215 | $125,821 |
| 2018 | $1,923 | $170,624 | $47,270 | $123,354 |
| 2017 | $1,908 | $167,280 | $46,344 | $120,936 |
| 2016 | $1,869 | $164,001 | $45,436 | $118,565 |
| 2015 | $1,845 | $161,539 | $44,754 | $116,785 |
| 2014 | $1,807 | $158,376 | $43,878 | $114,498 |
Source: Public Records
Map
Nearby Homes
- 3116 Larrynell Dr
- 2873 Malik Ave
- 926 Alcoy Dr
- 3129 Malik Ave
- 3005 Willetts Way
- 3501 Soda Canyon Dr
- 3096 Castle Rock Ct
- 2617 E Whitmore Ave
- 2677 Ocaso Way
- 1429 Don Pedro Rd
- 1628 Sungate Dr
- 1432 Don Pedro Rd
- 1725 Norwood Heights Ln
- 1617 Heath Way
- 1724 Don Pedro Rd
- 2005 Pleasant Ave
- 1951 Darrah St Unit 1
- 3033 Railroad Ave
- 2111 Hackett Rd
- 4080 Farm Supply Dr
- 2612 Fiesta Way
- 2651 Cameron Park Dr
- 2681 Cameron Park Dr
- 2604 Fiesta Way
- 2621 Cameron Park Dr
- 2591 Cameron Park Dr
- 2741 Cameron Park Dr
- 2600 Fiesta Way
- 2617 Fiesta Way
- 2613 Fiesta Way
- 2771 Cameron Park Dr
- 1401 Cameron Park Ct
- 1406 Cameron Park Ct
- 2609 Fiesta Way
- 1405 Strawberry Dr
- 2530 Fiesta Way
- 1405 Cameron Park Ct
- 2801 Cameron Park Dr
- 2605 Fiesta Way
- 2716 Morgan Rd