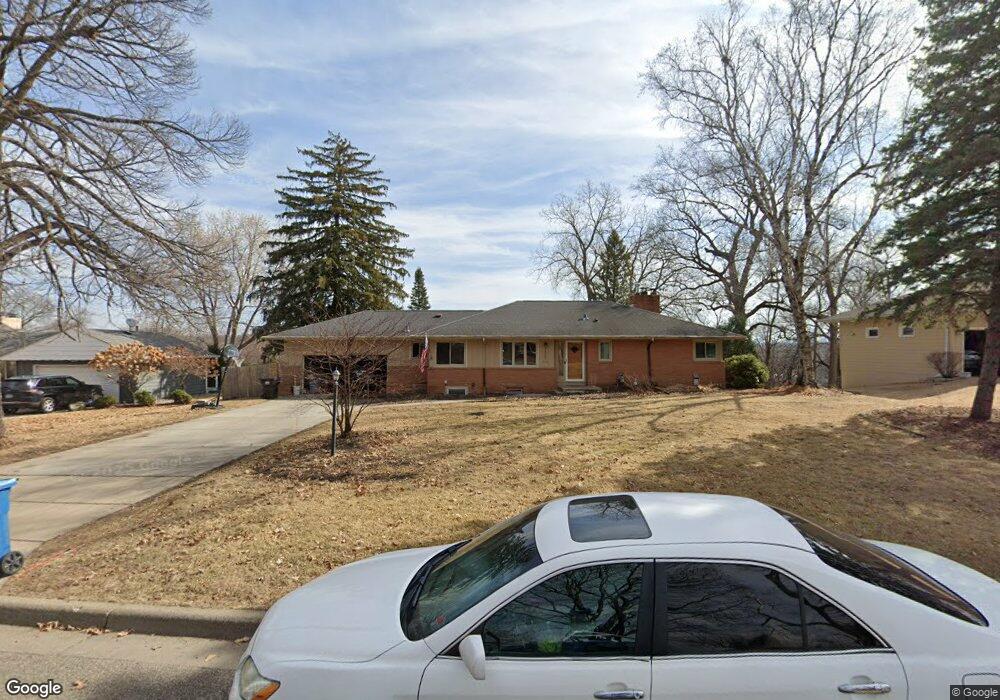
2620 Lee Ave N Golden Valley, MN 55422
Estimated Value: $542,000 - $586,000
5
Beds
3
Baths
3,095
Sq Ft
$182/Sq Ft
Est. Value
About This Home
This home is located at 2620 Lee Ave N, Golden Valley, MN 55422 and is currently estimated at $563,722, approximately $182 per square foot. 2620 Lee Ave N is a home located in Hennepin County with nearby schools including Noble Elementary School, Plymouth Middle School, and Armstrong High School.
Ownership History
Date
Name
Owned For
Owner Type
Purchase Details
Closed on
Jun 10, 2019
Sold by
Pomonis James D
Bought by
Lerner Oliver and Lerner Haley
Current Estimated Value
Home Financials for this Owner
Home Financials are based on the most recent Mortgage that was taken out on this home.
Original Mortgage
$316,000
Outstanding Balance
$277,841
Interest Rate
4.1%
Mortgage Type
New Conventional
Estimated Equity
$285,881
Purchase Details
Closed on
Aug 6, 2015
Sold by
Pomonis Michele M
Bought by
Pomonis James D
Home Financials for this Owner
Home Financials are based on the most recent Mortgage that was taken out on this home.
Original Mortgage
$244,000
Interest Rate
4.03%
Mortgage Type
New Conventional
Purchase Details
Closed on
Jul 9, 2004
Sold by
Heddens J David and Heddens Melissa J
Bought by
Pomonis James D and Pomonis Michele N
Purchase Details
Closed on
Dec 16, 1999
Sold by
Brink Stella A
Bought by
Heddens James D and Heddens Melissa J
Create a Home Valuation Report for This Property
The Home Valuation Report is an in-depth analysis detailing your home's value as well as a comparison with similar homes in the area
Home Values in the Area
Average Home Value in this Area
Purchase History
| Date | Buyer | Sale Price | Title Company |
|---|---|---|---|
| Lerner Oliver | $395,000 | Midland Title | |
| Pomonis James D | -- | Titlesmart Inc | |
| Pomonis James D | $389,500 | -- | |
| Heddens James D | $194,900 | -- |
Source: Public Records
Mortgage History
| Date | Status | Borrower | Loan Amount |
|---|---|---|---|
| Open | Lerner Oliver | $316,000 | |
| Previous Owner | Pomonis James D | $244,000 |
Source: Public Records
Tax History Compared to Growth
Tax History
| Year | Tax Paid | Tax Assessment Tax Assessment Total Assessment is a certain percentage of the fair market value that is determined by local assessors to be the total taxable value of land and additions on the property. | Land | Improvement |
|---|---|---|---|---|
| 2024 | $7,244 | $489,300 | $196,800 | $292,500 |
| 2023 | $6,838 | $477,300 | $186,000 | $291,300 |
| 2022 | $6,102 | $465,000 | $179,000 | $286,000 |
| 2021 | $5,818 | $407,000 | $169,000 | $238,000 |
| 2020 | $6,235 | $392,000 | $164,000 | $228,000 |
| 2019 | $6,154 | $403,000 | $184,000 | $219,000 |
| 2018 | $5,666 | $383,000 | $160,000 | $223,000 |
| 2017 | $6,185 | $350,000 | $144,000 | $206,000 |
| 2016 | $6,398 | $350,000 | $166,000 | $184,000 |
| 2015 | $6,012 | $326,000 | $142,000 | $184,000 |
| 2014 | -- | $280,000 | $114,000 | $166,000 |
Source: Public Records
Map
Nearby Homes
- 2611 Kyle Ave N
- 2641 Kyle Ave N
- 4605 Bassett Creek Ln
- 2841 Noble Ave N
- 4850 Dona Ln
- 2670 Quail Ave N
- 4920 Dawnview Terrace
- 2143 Noble Ave N
- 2923 France Ave N
- 4510 Heathbrooke Cir
- 2805 Regent Ave N
- 3142 Grimes Ave N
- 1919 Kyle Place
- 2430 Unity Ave N
- 3223 Halglo Place
- 2931 Chowen Ave N
- 3516 Manor Dr
- 3608 31st Ave N
- 3420 Parkview Blvd Unit 2
- 3240 Ewing Ave N
- 2630 Lee Ave N
- 2610 Lee Ave N
- 2621 Kyle Ave N
- 2631 Kyle Ave N
- 2621 Lee Ave N
- 2640 Lee Ave N
- 2600 Lee Ave N
- 2631 Lee Ave N
- 2611 Lee Ave N
- 2601 Kyle Ave N
- 2641 Lee Ave N
- 4500 Hampton Rd
- 2650 Lee Ave N
- 2516 Lee Ave N
- 2620 Major Ave N
- 2620 Kyle Ave N
- 2630 Major Ave N
- 2600 Major Ave N
- 2610 Kyle Ave N
- 2651 Kyle Ave N