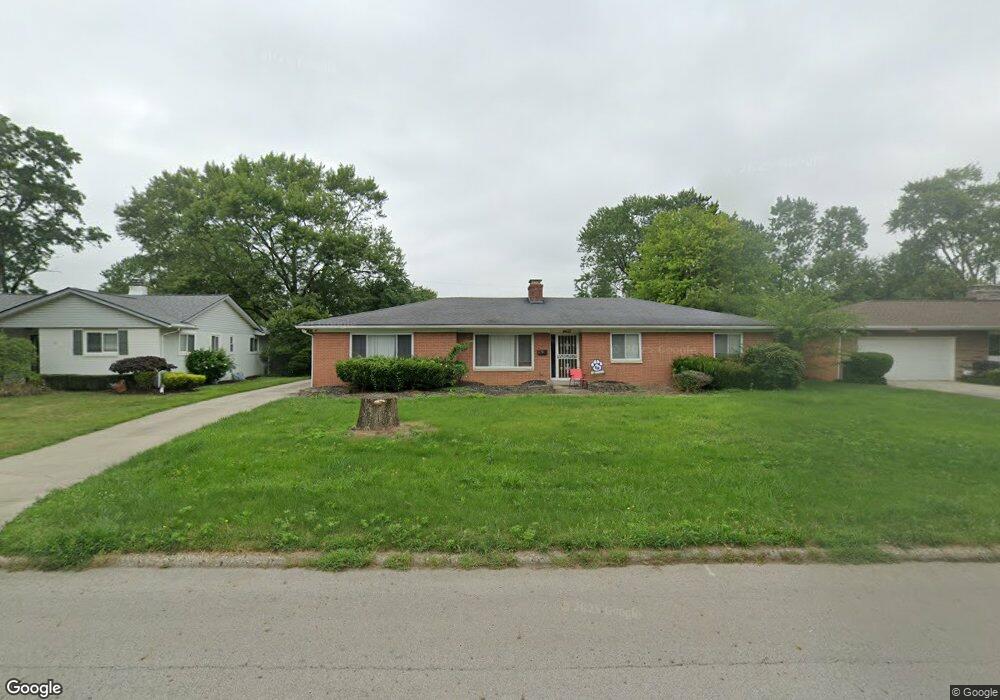
2620 Schaaf Dr Columbus, OH 43209
Berwick NeighborhoodEstimated Value: $329,000 - $422,000
3
Beds
2
Baths
1,629
Sq Ft
$223/Sq Ft
Est. Value
About This Home
This home is located at 2620 Schaaf Dr, Columbus, OH 43209 and is currently estimated at $363,678, approximately $223 per square foot. 2620 Schaaf Dr is a home located in Franklin County with nearby schools including Berwick Alternative K-8 School, Walnut Ridge High School, and Whitehall Preparatory And Fitness Academy.
Ownership History
Date
Name
Owned For
Owner Type
Purchase Details
Closed on
Mar 1, 2022
Sold by
Kendall Davis
Bought by
Kendall Davis Family Trust
Current Estimated Value
Purchase Details
Closed on
Feb 1, 2022
Sold by
Kendall Davis
Bought by
Kendall Davis Family Trust
Purchase Details
Closed on
Jun 24, 2020
Sold by
Keyes Elizabeth W
Bought by
Davis Kendall M
Home Financials for this Owner
Home Financials are based on the most recent Mortgage that was taken out on this home.
Original Mortgage
$142,500
Interest Rate
2.9%
Mortgage Type
New Conventional
Purchase Details
Closed on
Feb 8, 1993
Bought by
Keyes Elizabeth W
Purchase Details
Closed on
Dec 6, 1989
Create a Home Valuation Report for This Property
The Home Valuation Report is an in-depth analysis detailing your home's value as well as a comparison with similar homes in the area
Home Values in the Area
Average Home Value in this Area
Purchase History
| Date | Buyer | Sale Price | Title Company |
|---|---|---|---|
| Kendall Davis Family Trust | -- | Thomas Taneff Co Lpa | |
| Kendall Davis Family Trust | -- | Thomas Taneff Co Lpa | |
| Davis Kendall M | $150,000 | Great American Title | |
| Keyes Elizabeth W | -- | -- | |
| -- | -- | -- |
Source: Public Records
Mortgage History
| Date | Status | Borrower | Loan Amount |
|---|---|---|---|
| Previous Owner | Davis Kendall M | $142,500 |
Source: Public Records
Tax History Compared to Growth
Tax History
| Year | Tax Paid | Tax Assessment Tax Assessment Total Assessment is a certain percentage of the fair market value that is determined by local assessors to be the total taxable value of land and additions on the property. | Land | Improvement |
|---|---|---|---|---|
| 2024 | $5,123 | $112,530 | $32,760 | $79,770 |
| 2023 | $4,986 | $112,530 | $32,760 | $79,770 |
| 2022 | $4,303 | $82,960 | $20,340 | $62,620 |
| 2021 | $4,310 | $82,960 | $20,340 | $62,620 |
| 2020 | $3,861 | $82,960 | $20,340 | $62,620 |
| 2019 | $3,599 | $68,080 | $16,940 | $51,140 |
| 2018 | $3,276 | $68,080 | $16,940 | $51,140 |
| 2017 | $3,597 | $68,080 | $16,940 | $51,140 |
| 2016 | $3,179 | $56,740 | $11,730 | $45,010 |
| 2015 | $2,961 | $56,740 | $11,730 | $45,010 |
| 2014 | $2,893 | $56,740 | $11,730 | $45,010 |
| 2013 | $1,464 | $56,735 | $11,725 | $45,010 |
Source: Public Records
Map
Nearby Homes
- 2664 Sonata Dr
- 2639 Halleck Dr
- 1410 Wakefield Ct E
- 1535 Kenwick Rd
- 1677 Kenview Rd
- 2894 Landon Dr
- 2903 Scottwood Rd
- 2530 Berwick Blvd
- 1782 Newfield Rd
- 2676 Tudor Rd
- 1637 S James Rd
- 1205 Kenwick Rd
- 2810 Kingsrowe Ct Unit 13
- 2844 Kingsrowe Ct Unit 27
- 2846 Petzinger Rd Unit 70
- 1778 Quigley Rd
- 3084 Clermont Rd
- 2029 Burwell Dr Unit A
- 2395 Briers Dr
- 2468 Natchez Dr Unit D
- 2630 Schaaf Dr
- 2610 Schaaf Dr
- 2623 Floribunda Dr
- 2633 Floribunda Dr
- 2640 Schaaf Dr
- 2600 Schaaf Dr
- 2611 Floribunda Dr
- 2643 Floribunda Dr
- 2615 Schaaf Dr
- 2605 Schaaf Dr
- 2625 Schaaf Dr
- 2601 Floribunda Dr
- 2650 Schaaf Dr
- 2590 Schaaf Dr
- 2653 Floribunda Dr
- 2635 Schaaf Dr
- 2591 Floribunda Dr
- 2589 Schaaf Dr
- 2647 Schaaf Dr
- 1622 S Roosevelt Ave