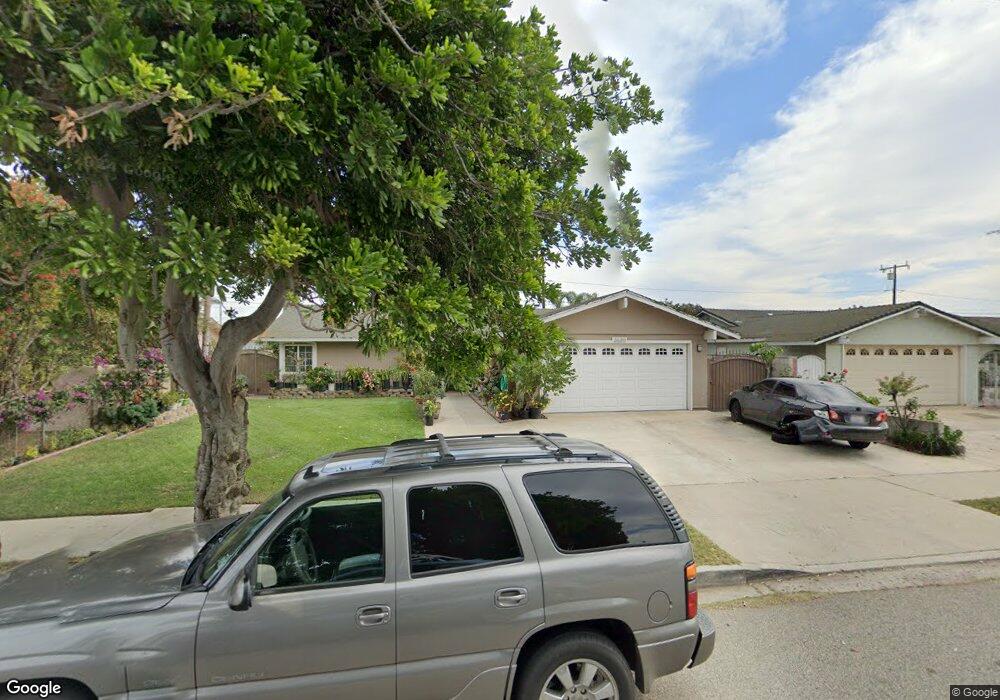
2620 Tulare Place Oxnard, CA 93033
Lemonwood Eastmont NeighborhoodEstimated Value: $611,000 - $821,000
4
Beds
2
Baths
1,180
Sq Ft
$608/Sq Ft
Est. Value
About This Home
This home is located at 2620 Tulare Place, Oxnard, CA 93033 and is currently estimated at $716,863, approximately $607 per square foot. 2620 Tulare Place is a home located in Ventura County with nearby schools including Lemonwood Elementary School, R.J. Frank Academy of Marine Science & Engineering, and Channel Islands High School.
Ownership History
Date
Name
Owned For
Owner Type
Purchase Details
Closed on
Aug 20, 2001
Sold by
Ruiz Juan and Ruiz Alicia
Bought by
Ruiz Juan and Ruiz Alicia
Current Estimated Value
Home Financials for this Owner
Home Financials are based on the most recent Mortgage that was taken out on this home.
Original Mortgage
$45,000
Interest Rate
6.75%
Purchase Details
Closed on
Dec 4, 1996
Sold by
Ruiz Felix
Bought by
Ruiz Juan and Ruiz Alicia
Purchase Details
Closed on
Jul 22, 1996
Sold by
The Federal Home Loan Mtg Corp
Bought by
Ruiz Juan and Ruiz Alicia
Home Financials for this Owner
Home Financials are based on the most recent Mortgage that was taken out on this home.
Original Mortgage
$107,200
Interest Rate
8.39%
Purchase Details
Closed on
Dec 14, 1995
Sold by
Ornelas Rudy G and Ornelas Margaret
Bought by
Federal Home Loan Mortgage Corporation
Purchase Details
Closed on
Oct 19, 1993
Sold by
Ornelas Margaret
Bought by
Ornelas Rudolfo
Create a Home Valuation Report for This Property
The Home Valuation Report is an in-depth analysis detailing your home's value as well as a comparison with similar homes in the area
Home Values in the Area
Average Home Value in this Area
Purchase History
| Date | Buyer | Sale Price | Title Company |
|---|---|---|---|
| Ruiz Juan | -- | Lawyers Title Company | |
| Ruiz Juan | -- | -- | |
| Ruiz Juan | $127,500 | Fidelity National Title Co | |
| Federal Home Loan Mortgage Corporation | $127,500 | Chicago Title Co | |
| Ornelas Rudolfo | -- | -- |
Source: Public Records
Mortgage History
| Date | Status | Borrower | Loan Amount |
|---|---|---|---|
| Closed | Ruiz Juan | $45,000 | |
| Previous Owner | Ruiz Juan | $107,200 |
Source: Public Records
Tax History Compared to Growth
Tax History
| Year | Tax Paid | Tax Assessment Tax Assessment Total Assessment is a certain percentage of the fair market value that is determined by local assessors to be the total taxable value of land and additions on the property. | Land | Improvement |
|---|---|---|---|---|
| 2025 | $2,556 | $214,920 | $85,969 | $128,951 |
| 2024 | $2,556 | $210,706 | $84,283 | $126,423 |
| 2023 | $2,463 | $206,575 | $82,630 | $123,945 |
| 2022 | $2,388 | $202,525 | $81,010 | $121,515 |
| 2021 | $2,367 | $198,554 | $79,421 | $119,133 |
| 2020 | $2,410 | $196,519 | $78,607 | $117,912 |
| 2019 | $2,341 | $192,666 | $77,066 | $115,600 |
| 2018 | $2,307 | $188,889 | $75,555 | $113,334 |
| 2017 | $2,189 | $185,186 | $74,074 | $111,112 |
| 2016 | $2,112 | $181,556 | $72,622 | $108,934 |
| 2015 | $2,133 | $178,831 | $71,532 | $107,299 |
| 2014 | -- | $175,331 | $70,132 | $105,199 |
Source: Public Records
Map
Nearby Homes
- 2630 El Dorado Ave Unit B
- 1864 San Mateo Place
- 1853 Ives Ave Unit 61
- 0 Oxnard Blvd Unit 25590841
- 2136 Thrush Ave Unit 2136
- 2143 Cardinal Ave Unit 2143
- 2733 Tolstoy Place Unit 104
- 2374 Nash Ln
- 4108 Ranchita Ln
- 1004 Cheyenne Way
- 4210 Drake Dr
- 1630 Nelson Place
- 4440 Reeder Ave
- 1220 Lindsay Place
- 840 Morro Way
- 2064 Walden St
- 3039 Fournier St
- 3151 Fournier St
- 521 Del Sur Way
- 4700 Hamilton Ave
- 2610 Tulare Place
- 2630 Tulare Place
- 2621 El Dorado Ave
- 2600 Tulare Place
- 2700 Tulare Place
- 2611 El Dorado Ave
- 2631 El Dorado Ave
- 2621 Tulare Place
- 2611 Tulare Place
- 2631 Tulare Place
- 2701 El Dorado Ave
- 2601 El Dorado Ave
- 2540 Tulare Place
- 2710 Tulare Place
- 2601 Tulare Place
- 2701 Tulare Place
- 2711 El Dorado Ave
- 2541 El Dorado Ave
- 2541 Tulare Place
- 2711 Tulare Place