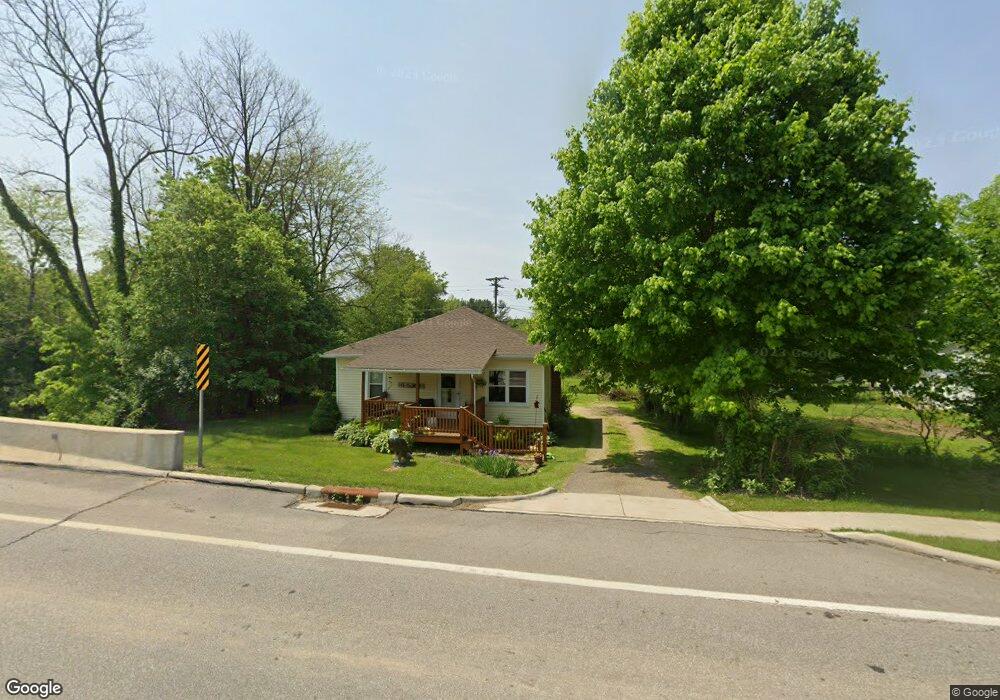
26208 Coshocton Rd Howard, OH 43028
Estimated Value: $115,000 - $190,000
2
Beds
1
Bath
784
Sq Ft
$192/Sq Ft
Est. Value
About This Home
This home is located at 26208 Coshocton Rd, Howard, OH 43028 and is currently estimated at $150,368, approximately $191 per square foot. 26208 Coshocton Rd is a home located in Knox County with nearby schools including East Knox Elementary School and East Knox High School.
Ownership History
Date
Name
Owned For
Owner Type
Purchase Details
Closed on
Nov 25, 2024
Sold by
Ash Danny D
Bought by
Seitz Carley R
Current Estimated Value
Home Financials for this Owner
Home Financials are based on the most recent Mortgage that was taken out on this home.
Original Mortgage
$92,225
Outstanding Balance
$91,431
Interest Rate
6.32%
Mortgage Type
New Conventional
Estimated Equity
$58,937
Purchase Details
Closed on
Jan 6, 2007
Sold by
Chapin Kenneth M and Chapin Laura T
Bought by
Ash Danny D and Ash Molley S
Home Financials for this Owner
Home Financials are based on the most recent Mortgage that was taken out on this home.
Original Mortgage
$64,000
Interest Rate
6.24%
Mortgage Type
New Conventional
Purchase Details
Closed on
Aug 26, 2004
Sold by
Davis Ivy L
Bought by
Chapin Kenneth M and Chapin Laura
Purchase Details
Closed on
Dec 17, 2002
Sold by
Davis Cecil M and Davis Ivy L
Bought by
Davis Ivy L
Create a Home Valuation Report for This Property
The Home Valuation Report is an in-depth analysis detailing your home's value as well as a comparison with similar homes in the area
Home Values in the Area
Average Home Value in this Area
Purchase History
| Date | Buyer | Sale Price | Title Company |
|---|---|---|---|
| Seitz Carley R | $116,300 | None Listed On Document | |
| Ash Danny D | $48,000 | None Available | |
| Chapin Kenneth M | $32,000 | -- | |
| Davis Ivy L | -- | -- |
Source: Public Records
Mortgage History
| Date | Status | Borrower | Loan Amount |
|---|---|---|---|
| Open | Seitz Carley R | $92,225 | |
| Previous Owner | Ash Danny D | $64,000 |
Source: Public Records
Tax History Compared to Growth
Tax History
| Year | Tax Paid | Tax Assessment Tax Assessment Total Assessment is a certain percentage of the fair market value that is determined by local assessors to be the total taxable value of land and additions on the property. | Land | Improvement |
|---|---|---|---|---|
| 2024 | $733 | $17,910 | $3,730 | $14,180 |
| 2023 | $733 | $17,910 | $3,730 | $14,180 |
| 2022 | $594 | $12,350 | $2,570 | $9,780 |
| 2021 | $594 | $12,350 | $2,570 | $9,780 |
| 2020 | $566 | $12,350 | $2,570 | $9,780 |
| 2019 | $713 | $14,350 | $2,780 | $11,570 |
| 2018 | $669 | $14,350 | $2,780 | $11,570 |
| 2017 | $663 | $14,350 | $2,780 | $11,570 |
| 2016 | $622 | $13,280 | $2,570 | $10,710 |
| 2015 | $568 | $13,280 | $2,570 | $10,710 |
| 2014 | $542 | $13,280 | $2,570 | $10,710 |
| 2013 | $561 | $12,970 | $2,420 | $10,550 |
Source: Public Records
Map
Nearby Homes
- 11812 Bridge St
- 11794 Bridge St
- 26199 Coshocton Rd
- 11778 Bridge St
- 26276 Coshocton Rd
- 11838 Bridge St
- 26160 Coshocton Rd
- 26155 Coshocton Ave
- 11760 Bridge St
- 11848 Bridge St
- 11783 Bridge St
- 11841 Bridge St
- 11853 Bridge St
- 11763 Bridge St
- 26145 Coshocton Rd
- 26132 Coshocton Rd
- 26132 Coshocton Rd
- 11753 Bridge St
- 26129 Coshocton Rd
- 11863 Bridge St