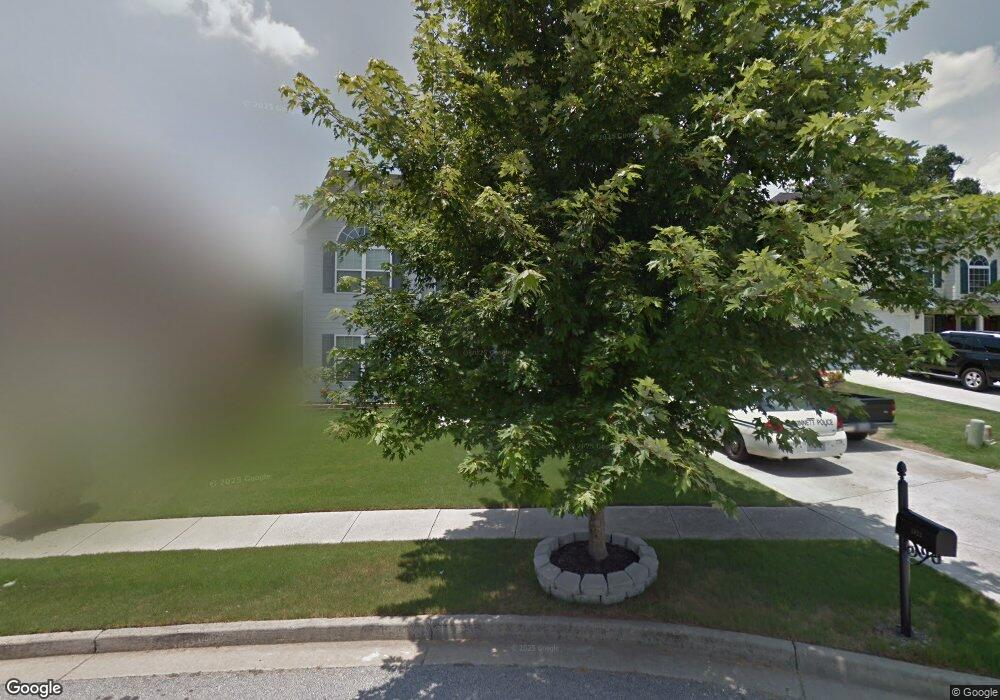
2623 Austin Ridge Dr Dacula, GA 30019
Estimated Value: $373,000 - $417,000
4
Beds
3
Baths
2,696
Sq Ft
$145/Sq Ft
Est. Value
About This Home
This home is located at 2623 Austin Ridge Dr, Dacula, GA 30019 and is currently estimated at $391,693, approximately $145 per square foot. 2623 Austin Ridge Dr is a home located in Gwinnett County with nearby schools including Dacula Elementary School, Dacula Middle School, and Dacula High School.
Ownership History
Date
Name
Owned For
Owner Type
Purchase Details
Closed on
Jun 4, 2020
Sold by
Property Owner 10 Llc
Bought by
Progress Residential Borrower 14 Llc
Current Estimated Value
Purchase Details
Closed on
Jul 26, 2019
Sold by
Offerpad Spvborrower 1 Llc
Bought by
Property Owner 10 Llc
Purchase Details
Closed on
Jun 24, 2019
Sold by
Poche Christine
Bought by
Offerpad Spvborrower1
Purchase Details
Closed on
Jun 23, 2008
Sold by
Cwalt Inc Trust 2006-Oc8
Bought by
Poche Wayne and Poche Christine
Home Financials for this Owner
Home Financials are based on the most recent Mortgage that was taken out on this home.
Original Mortgage
$164,834
Interest Rate
6.37%
Mortgage Type
FHA
Purchase Details
Closed on
Feb 5, 2008
Sold by
Kavanaugh-Hogans Marisa N
Bought by
Bank Of New York 2006-Oc8
Create a Home Valuation Report for This Property
The Home Valuation Report is an in-depth analysis detailing your home's value as well as a comparison with similar homes in the area
Home Values in the Area
Average Home Value in this Area
Purchase History
| Date | Buyer | Sale Price | Title Company |
|---|---|---|---|
| Progress Residential Borrower 14 Llc | -- | -- | |
| Property Owner 10 Llc | $207,000 | -- | |
| Offerpad Spvborrower1 | $219,477 | -- | |
| Poche Wayne | $167,500 | -- | |
| Bank Of New York 2006-Oc8 | $178,934 | -- |
Source: Public Records
Mortgage History
| Date | Status | Borrower | Loan Amount |
|---|---|---|---|
| Previous Owner | Poche Wayne | $164,834 |
Source: Public Records
Tax History Compared to Growth
Tax History
| Year | Tax Paid | Tax Assessment Tax Assessment Total Assessment is a certain percentage of the fair market value that is determined by local assessors to be the total taxable value of land and additions on the property. | Land | Improvement |
|---|---|---|---|---|
| 2025 | $5,191 | $161,680 | $30,000 | $131,680 |
| 2024 | $5,859 | $154,880 | $30,400 | $124,480 |
| 2023 | $5,859 | $98,000 | $18,400 | $79,600 |
| 2022 | $3,811 | $98,000 | $18,400 | $79,600 |
| 2021 | $3,310 | $100,960 | $18,400 | $82,560 |
| 2020 | $3,328 | $82,800 | $18,400 | $64,400 |
| 2019 | $2,999 | $85,560 | $15,200 | $70,360 |
| 2018 | $3,001 | $85,560 | $15,200 | $70,360 |
| 2016 | $2,711 | $74,000 | $12,000 | $62,000 |
| 2015 | $2,316 | $62,080 | $11,200 | $50,880 |
| 2014 | -- | $51,200 | $8,000 | $43,200 |
Source: Public Records
Map
Nearby Homes
- 2693 Austin Ridge Dr
- 2768 Ballyshannon Ct
- 2827 Riders Ct
- 2896 Spence Ct
- 2793 Austin Ridge Dr
- 535 Maeve Ln
- 2819 Heritage Oaks Cir Unit 7
- 2879 Heritage Oaks Cir
- 2623 Carleton Gold Rd
- 67 Creek Side Place
- 2652 Carleton Gold Rd
- 2015 Waycross Ln
- 2304 Pelham Pass
- 2407 Pelham Pass
- 3507 Fishpond Cir
- 3527 Fishpond Cir
- 2901 Tree Top Rd
- 2800 Araglin Dr
- 2633 Austin Ridge Dr
- 2633 Austin Ridge Dr NE
- 2613 Austin Ridge Dr
- 0 Austin Ridge Dr NE Unit 7504813
- 0 Austin Ridge Dr NE Unit 8499883
- 0 Austin Ridge Dr NE Unit 8126309
- 0 Austin Ridge Dr NE Unit 8107175
- 0 Austin Ridge Dr NE Unit 8093514
- 0 Austin Ridge Dr NE Unit 7625335
- 0 Austin Ridge Dr NE Unit 7413387
- 0 Austin Ridge Dr NE Unit 7262290
- 0 Austin Ridge Dr NE Unit 7569243
- 0 Austin Ridge Dr NE Unit 7185438
- 0 Austin Ridge Dr NE Unit 8973720
- 0 Austin Ridge Dr NE Unit 9073696
- 0 Austin Ridge Dr NE Unit 8761497
- 0 Austin Ridge Dr NE Unit 8923558
- 0 Austin Ridge Dr NE Unit 3172098
- 0 Austin Ridge Dr NE Unit 3214113
- 0 Austin Ridge Dr NE Unit 3250398