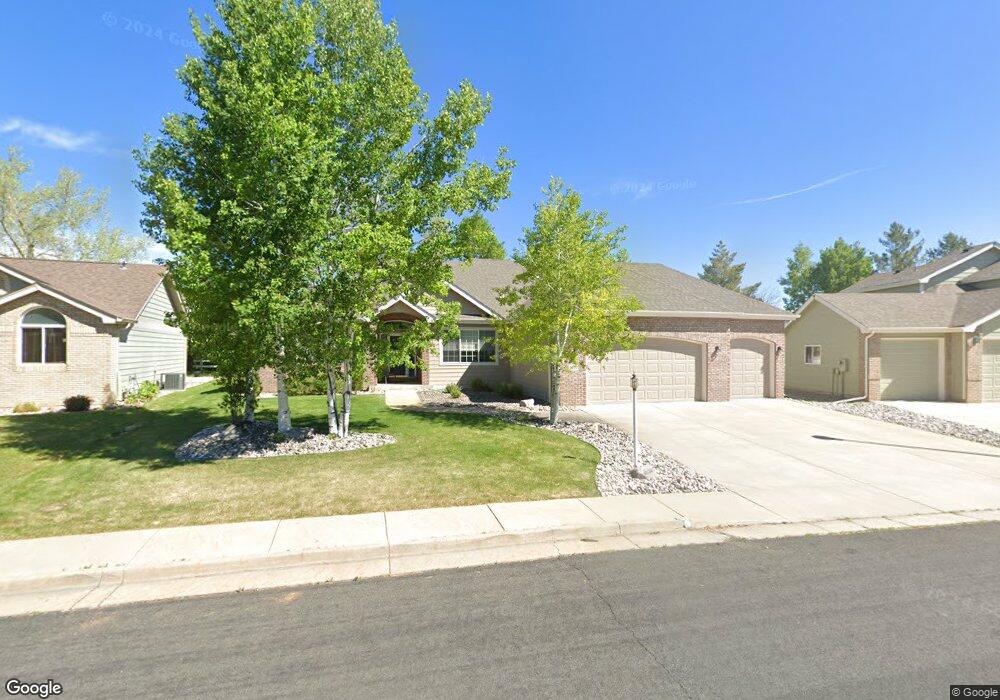
2623 Glendale Dr Loveland, CO 80538
Estimated Value: $517,029 - $661,000
3
Beds
2
Baths
1,821
Sq Ft
$329/Sq Ft
Est. Value
About This Home
This home is located at 2623 Glendale Dr, Loveland, CO 80538 and is currently estimated at $599,757, approximately $329 per square foot. 2623 Glendale Dr is a home located in Larimer County with nearby schools including Centennial Elementary School, Lucile Erwin Middle School, and Loveland High School.
Ownership History
Date
Name
Owned For
Owner Type
Purchase Details
Closed on
Apr 30, 2002
Sold by
Clemmer Jeffrey R and Clemmer Laurene R
Bought by
Traphagan Ricky L and Traphagan Susan K
Current Estimated Value
Home Financials for this Owner
Home Financials are based on the most recent Mortgage that was taken out on this home.
Original Mortgage
$206,400
Outstanding Balance
$82,170
Interest Rate
6.12%
Estimated Equity
$517,588
Purchase Details
Closed on
Feb 20, 1998
Sold by
Glen Homes Llc
Bought by
Clemmer Jeffrey R and Clemmer Laurene R
Home Financials for this Owner
Home Financials are based on the most recent Mortgage that was taken out on this home.
Original Mortgage
$159,580
Interest Rate
6.91%
Purchase Details
Closed on
Jun 10, 1997
Sold by
Glen Properties Inc
Bought by
Glen Homes Llc
Purchase Details
Closed on
Apr 1, 1996
Sold by
Emerald Glen Loveland Community Assn
Bought by
Glen Properties Inc
Create a Home Valuation Report for This Property
The Home Valuation Report is an in-depth analysis detailing your home's value as well as a comparison with similar homes in the area
Home Values in the Area
Average Home Value in this Area
Purchase History
| Date | Buyer | Sale Price | Title Company |
|---|---|---|---|
| Traphagan Ricky L | $258,000 | Land Title Guarantee Company | |
| Clemmer Jeffrey R | $199,475 | -- | |
| Glen Homes Llc | $36,000 | -- | |
| Glen Properties Inc | -- | -- |
Source: Public Records
Mortgage History
| Date | Status | Borrower | Loan Amount |
|---|---|---|---|
| Open | Traphagan Ricky L | $206,400 | |
| Previous Owner | Clemmer Jeffrey R | $159,580 |
Source: Public Records
Tax History Compared to Growth
Tax History
| Year | Tax Paid | Tax Assessment Tax Assessment Total Assessment is a certain percentage of the fair market value that is determined by local assessors to be the total taxable value of land and additions on the property. | Land | Improvement |
|---|---|---|---|---|
| 2025 | $2,276 | $38,900 | $3,330 | $35,570 |
| 2024 | $2,195 | $38,900 | $3,330 | $35,570 |
| 2022 | $1,738 | $28,787 | $3,454 | $25,333 |
| 2021 | $1,786 | $29,616 | $3,554 | $26,062 |
| 2020 | $1,856 | $30,495 | $3,554 | $26,941 |
| 2019 | $1,825 | $30,495 | $3,554 | $26,941 |
| 2018 | $1,586 | $26,474 | $3,578 | $22,896 |
| 2017 | $1,366 | $26,474 | $3,578 | $22,896 |
| 2016 | $1,858 | $25,337 | $3,956 | $21,381 |
| 2015 | $1,843 | $25,340 | $3,960 | $21,380 |
| 2014 | $1,672 | $22,240 | $3,960 | $18,280 |
Source: Public Records
Map
Nearby Homes
- 2554 W 44th St
- 2643 W 45th St
- 2465 Glen Isle Dr
- 2684 W 46th St
- 2597 W 46th St
- 4559 Keota Place
- 2250 W 44th St
- 3007 Benfold St
- 2960 Kincaid Dr Unit 303
- 3890 Kremmling Dr
- 4106 Cripple Creek Dr
- 3902 Penrose Ave
- 2920 Donatello St
- 4719 Degas Dr
- 4725 Degas Dr
- 4733 Degas Dr
- 2958 Donatello St
- 4705 Whistler Dr
- 4745 Degas Dr
- 3017 Thorn Cir
- 2615 Glendale Dr
- 2631 Glendale Dr
- 2620 Glendale Dr
- 2607 Glendale Dr
- 2634 Glendale Dr
- 2606 Glendale Dr
- 2653 Glendale Dr
- 2648 Glendale Dr
- 2682 W 44th St
- 2599 Glendale Dr
- 2666 W 44th St
- 2650 W 44th St
- 2592 Glendale Dr
- 2698 W 44th St
- 4196 Glen Isle Ct
- 2667 Glendale Dr
- 4172 Glen Isle Ct
- 2634 W 44th St
- 2702 Glendale Dr
- 2547 Glendale Ct