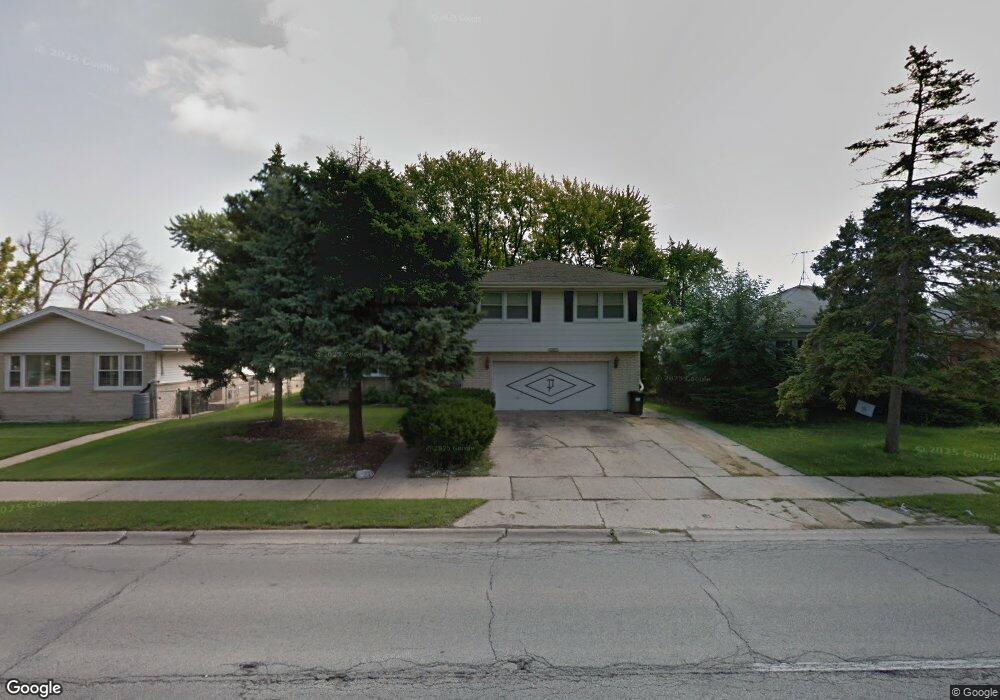
2623 Maple Ave Brookfield, IL 60513
Estimated Value: $360,000 - $422,000
3
Beds
3
Baths
1,992
Sq Ft
$195/Sq Ft
Est. Value
About This Home
This home is located at 2623 Maple Ave, Brookfield, IL 60513 and is currently estimated at $388,510, approximately $195 per square foot. 2623 Maple Ave is a home located in Cook County with nearby schools including S. E. Gross Middle School, Brook Park Elementary School, and Riverside Brookfield High School.
Ownership History
Date
Name
Owned For
Owner Type
Purchase Details
Closed on
Sep 1, 2017
Sold by
Prado Rosalba and Prado Juan
Bought by
Prado Juan
Current Estimated Value
Home Financials for this Owner
Home Financials are based on the most recent Mortgage that was taken out on this home.
Original Mortgage
$175,000
Outstanding Balance
$119,453
Interest Rate
4.25%
Mortgage Type
New Conventional
Estimated Equity
$269,057
Purchase Details
Closed on
Jul 2, 2008
Sold by
Bank Of New York
Bought by
Prado Rosalba and Prado Juan
Home Financials for this Owner
Home Financials are based on the most recent Mortgage that was taken out on this home.
Original Mortgage
$185,600
Interest Rate
6.41%
Mortgage Type
Unknown
Purchase Details
Closed on
Sep 26, 2007
Sold by
Rocha Martha
Bought by
Bank Of New York and The Certificateholders Cwabs Inc Asset B
Create a Home Valuation Report for This Property
The Home Valuation Report is an in-depth analysis detailing your home's value as well as a comparison with similar homes in the area
Home Values in the Area
Average Home Value in this Area
Purchase History
| Date | Buyer | Sale Price | Title Company |
|---|---|---|---|
| Prado Juan | -- | Fidelity National Title | |
| Prado Rosalba | $232,000 | None Available | |
| Bank Of New York | -- | None Available |
Source: Public Records
Mortgage History
| Date | Status | Borrower | Loan Amount |
|---|---|---|---|
| Open | Prado Juan | $175,000 | |
| Previous Owner | Prado Rosalba | $185,600 |
Source: Public Records
Tax History
| Year | Tax Paid | Tax Assessment Tax Assessment Total Assessment is a certain percentage of the fair market value that is determined by local assessors to be the total taxable value of land and additions on the property. | Land | Improvement |
|---|---|---|---|---|
| 2025 | $5,835 | $18,001 | $3,259 | $14,742 |
| 2024 | $5,835 | $18,001 | $3,259 | $14,742 |
| 2023 | $5,541 | $18,001 | $3,259 | $14,742 |
| 2022 | $5,541 | $15,008 | $2,793 | $12,215 |
| 2021 | $5,393 | $15,007 | $2,793 | $12,214 |
| 2020 | $5,299 | $15,007 | $2,793 | $12,214 |
| 2019 | $5,135 | $14,736 | $2,560 | $12,176 |
| 2018 | $5,656 | $16,655 | $2,560 | $14,095 |
| 2017 | $5,225 | $16,655 | $2,560 | $14,095 |
| 2016 | $4,938 | $14,515 | $2,327 | $12,188 |
| 2015 | $4,724 | $14,515 | $2,327 | $12,188 |
| 2014 | $4,665 | $14,515 | $2,327 | $12,188 |
| 2013 | $4,142 | $13,890 | $2,327 | $11,563 |
Source: Public Records
Map
Nearby Homes
- 9120 26th Place
- 1424 N Maple Ave
- 9027 27th St
- 1220 N Maple Ave
- 2310 S 17th Ave
- 1127 Morgan Ave
- 2263 S 14th Ave
- 3108 Oak Ave
- 1138 Cleveland Ave
- 8900 31st St Unit 8
- 2334 S 10th Ave
- 3201 Park Ave
- 3229 Maple Ave
- 3227 Harrison Ave
- 3321 Harrison Ave
- 9516 Jackson Ave
- 1211 Homestead Rd
- 2522 S 3rd Ave
- 3417 Oak Ave
- 9512 Jefferson Ave
- 2623 Maple Ave
- 2629 Maple Ave
- 2621 Maple Ave
- 2621 S Maple Ave
- 2635 Maple Ave
- 9135 26th Place
- 9135 26th Place
- 2639 Maple Ave
- 9134 27th St
- 2619 Maple Ave
- 1514 N Maple Ave
- 1518 N Maple Ave
- 1518 N Maple Ave
- 1510 N Maple Ave
- 9128 27th St
- 1522 N Maple Ave
- 1522 N Maple Ave
- 1504 N Maple Ave
- 1504 N Maple Ave
- 9127 26th Place
Your Personal Tour Guide
Ask me questions while you tour the home.