2623 Marsh Dr San Ramon, CA 94583
Twin Creeks NeighborhoodEstimated Value: $846,000 - $978,000
About This Home
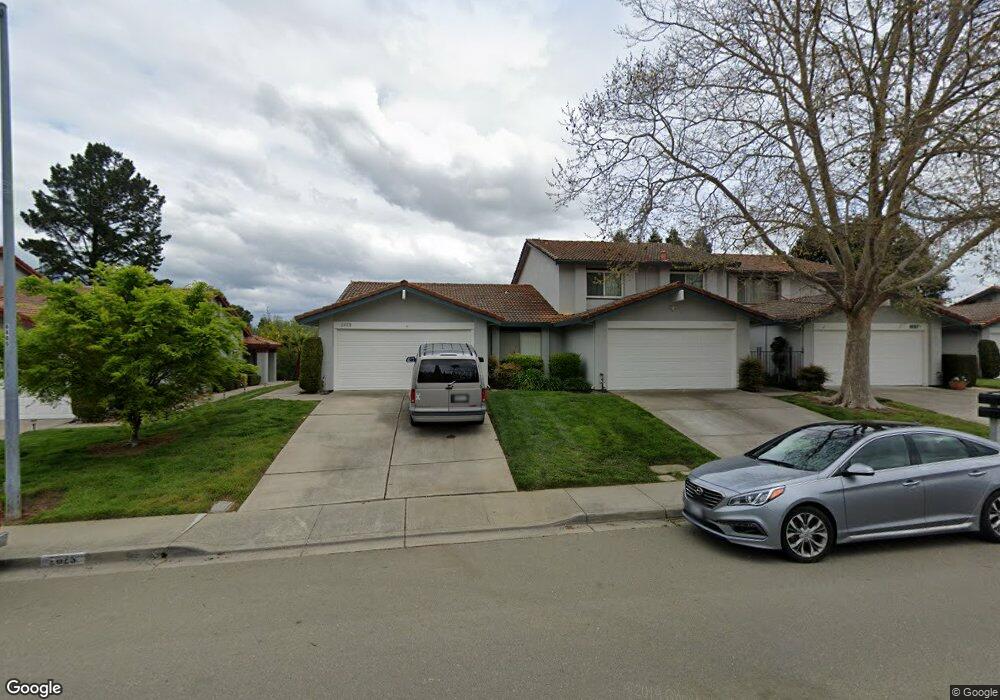
This home is located at 2623 Marsh Dr, San Ramon, CA 94583 and is currently estimated at $920,762, approximately $632 per square foot. 2623 Marsh Dr is a home located in Contra Costa County with nearby schools including Twin Creeks Elementary School, Iron Horse Middle School, and California High School.
Ownership History
We collect this data history from publicly available records. To have your information removed, we recommend requesting removal directly through your county’s website.
Purchase Details
Purchase Details
Home Financials for this Owner
Home Financials are based on the most recent Mortgage that was taken out on this home.Purchase Details
Home Financials for this Owner
Home Financials are based on the most recent Mortgage that was taken out on this home.Purchase Details
Home Financials for this Owner
Home Financials are based on the most recent Mortgage that was taken out on this home.Purchase Details
Home Financials for this Owner
Home Financials are based on the most recent Mortgage that was taken out on this home.Purchase Details
Home Financials for this Owner
Home Financials are based on the most recent Mortgage that was taken out on this home.Purchase Details
Home Financials for this Owner
Home Financials are based on the most recent Mortgage that was taken out on this home.Purchase Details
Home Financials for this Owner
Home Financials are based on the most recent Mortgage that was taken out on this home.Purchase Details
Home Financials for this Owner
Home Financials are based on the most recent Mortgage that was taken out on this home.Purchase Details
Home Financials for this Owner
Home Financials are based on the most recent Mortgage that was taken out on this home.Purchase Details
Home Financials for this Owner
Home Financials are based on the most recent Mortgage that was taken out on this home.Purchase Details
Home Financials for this Owner
Home Financials are based on the most recent Mortgage that was taken out on this home.Home Values in the Area
Average Home Value in this Area
Purchase History
We collect this data history from publicly available records. To have your information removed, we recommend requesting removal directly through your county’s website.
| Date | Buyer | Sale Price | Title Company |
|---|---|---|---|
| -- | None Available | ||
| -- | Fidelity National Title Co | ||
| -- | Fidelity National Title Co | ||
| -- | Fidelity National Title Co | ||
| -- | Fidelity National Title Co | ||
| -- | Fidelity National Title Co | ||
| -- | First California Title | ||
| -- | First California Title | ||
| -- | First California Title | ||
| -- | First California Title | ||
| -- | -- | ||
| -- | First California Title | ||
| -- | First California Title Compa | ||
| -- | First California Title Compa | ||
| -- | First California Title Compa | ||
| $346,000 | First California Title Compa | ||
| -- | First American Title Guarant | ||
| $242,000 | First American Title Guarant |
Mortgage History
We collect this data history from publicly available records. To have your information removed, we recommend requesting removal directly through your county’s website.
| Date | Status | Borrower | Loan Amount |
|---|---|---|---|
| Open | $290,000 | ||
| Closed | $260,000 | ||
| Closed | $264,000 | ||
| Closed | $216,400 | ||
| Closed | $216,400 | ||
| Closed | $217,000 | ||
| Closed | $218,000 | ||
| Closed | $220,000 | ||
| Previous Owner | $193,600 |
Tax History
We collect this data history from publicly available records. To have your information removed, we recommend requesting removal directly through your county’s website.
| Year | Tax Paid | Tax Assessment Tax Assessment Total Assessment is a certain percentage of the fair market value that is determined by local assessors to be the total taxable value of land and additions on the property. | Land | Improvement |
|---|---|---|---|---|
| 2025 | $6,457 | $521,346 | $169,508 | $351,838 |
| 2024 | $6,315 | $511,125 | $166,185 | $344,940 |
| 2023 | $6,202 | $501,104 | $162,927 | $338,177 |
| 2022 | $6,153 | $491,280 | $159,733 | $331,547 |
| 2021 | $6,010 | $481,648 | $156,601 | $325,047 |
| 2019 | $5,856 | $467,364 | $151,957 | $315,407 |
| 2018 | $5,631 | $458,201 | $148,978 | $309,223 |
| 2017 | $5,415 | $449,217 | $146,057 | $303,160 |
| 2016 | $5,330 | $440,410 | $143,194 | $297,216 |
| 2015 | $5,247 | $433,796 | $141,044 | $292,752 |
| 2014 | $5,161 | $425,300 | $138,282 | $287,018 |
Map
- 491 Santander Dr
- 105 Rosario Ct
- 2517 Aranda Dr
- 2539 Aranda Dr
- 2675 Durango Ln
- 165 Rosario Ct
- 199 Rosario Ct
- 418 Santander Dr
- 2481 Palmira Place
- 2790 Marsh Dr
- 309 La Paz Ct
- 2762 Derby Dr
- 2785 Canyon Creek Dr
- 2782 Canyon Creek Dr
- 207 Bisque Ct
- 522 Lapis Ct
- 321 Isabelline Ct
- 325 Isabelline Ct
- 326 Isabelline Ct
- 5001 Seashell Terrace
- 2579 Toltec Cir
- 2580 Marsh Dr
- 2575 Toltec Cir
- 2606 Marsh Dr
- 2597 Marsh Dr
- 2578 Marsh Dr
- 2599 Marsh Dr
- 2593 Marsh Dr
- 2576 Toltec Cir
- 2563 Toltec Cir
- 3704 Mesa Vista Dr
- 2607 Marsh Dr
- 3708 Mesa Vista Dr
- 3712 Mesa Vista Dr
- 2611 Marsh Dr
- 2619 Marsh Dr
- 2622 Marsh Dr
- 2572 Toltec Cir
- 2559 Toltec Cir
- 3703 Mesa Vista Dr
Ask me questions while you tour the home.