Estimated Value: $390,481 - $514,000
--
Bed
3
Baths
1,696
Sq Ft
$262/Sq Ft
Est. Value
About This Home
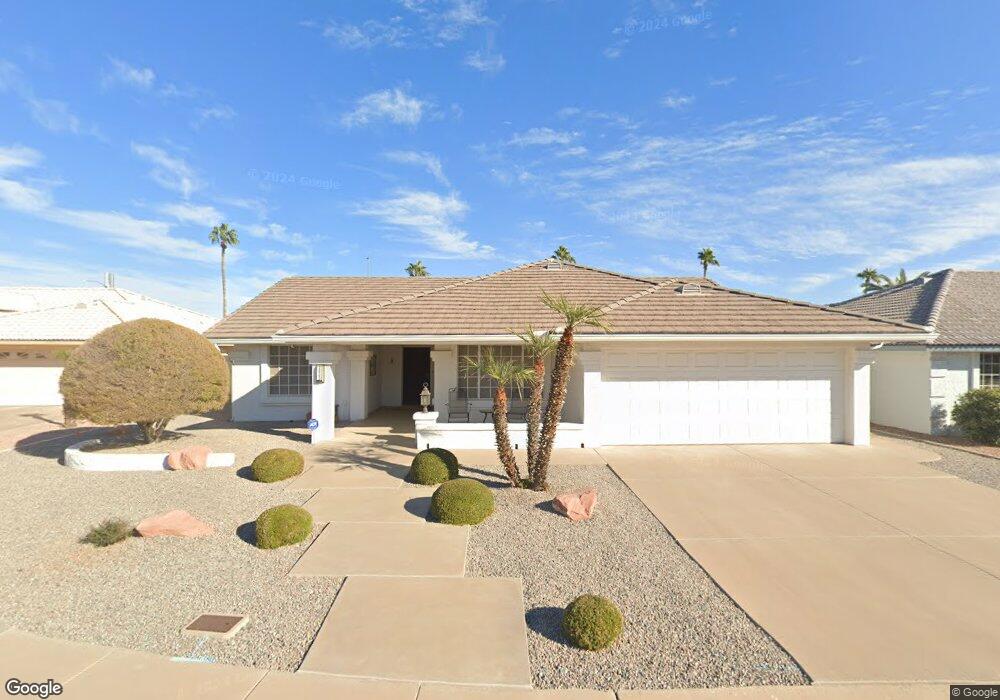
This home is located at 2623 S Honeysuckle Cir, Mesa, AZ 85209 and is currently estimated at $444,120, approximately $261 per square foot. 2623 S Honeysuckle Cir is a home located in Maricopa County with nearby schools including Boulder Creek Elementary School, Desert Ridge Jr. High School, and Desert Ridge High School.
Ownership History
Date
Name
Owned For
Owner Type
Purchase Details
Closed on
Nov 27, 2002
Sold by
Richardson Gene O and Richardson Donna Lee
Bought by
Richardson Gene O and Richardson Donna Lee
Current Estimated Value
Home Financials for this Owner
Home Financials are based on the most recent Mortgage that was taken out on this home.
Original Mortgage
$135,500
Interest Rate
6.06%
Purchase Details
Closed on
Sep 15, 1995
Sold by
Richardson Gene O and Richardson Donna Lee
Bought by
Richardson Gene O and Richardson Donna Lee
Purchase Details
Closed on
Jun 13, 1995
Sold by
Transamerica Title Insurance Co
Bought by
Richardson Gene O and Richardson Donna Lee
Home Financials for this Owner
Home Financials are based on the most recent Mortgage that was taken out on this home.
Original Mortgage
$75,000
Interest Rate
7.63%
Mortgage Type
Purchase Money Mortgage
Create a Home Valuation Report for This Property
The Home Valuation Report is an in-depth analysis detailing your home's value as well as a comparison with similar homes in the area
Home Values in the Area
Average Home Value in this Area
Purchase History
| Date | Buyer | Sale Price | Title Company |
|---|---|---|---|
| Richardson Gene O | -- | Security Title Agency | |
| Richardson Gene O | -- | Security Title Agency | |
| Richardson Gene O | -- | -- | |
| Richardson Gene O | $144,859 | Transamerica Title Ins Co |
Source: Public Records
Mortgage History
| Date | Status | Borrower | Loan Amount |
|---|---|---|---|
| Closed | Richardson Gene O | $135,500 | |
| Previous Owner | Richardson Gene O | $75,000 |
Source: Public Records
Tax History Compared to Growth
Tax History
| Year | Tax Paid | Tax Assessment Tax Assessment Total Assessment is a certain percentage of the fair market value that is determined by local assessors to be the total taxable value of land and additions on the property. | Land | Improvement |
|---|---|---|---|---|
| 2025 | $2,001 | $27,023 | -- | -- |
| 2024 | $1,942 | $25,737 | -- | -- |
| 2023 | $1,942 | $30,680 | $6,130 | $24,550 |
| 2022 | $1,895 | $26,210 | $5,240 | $20,970 |
| 2021 | $2,052 | $24,130 | $4,820 | $19,310 |
| 2020 | $2,017 | $21,630 | $4,320 | $17,310 |
| 2019 | $1,869 | $20,310 | $4,060 | $16,250 |
| 2018 | $1,779 | $19,610 | $3,920 | $15,690 |
| 2017 | $1,723 | $19,260 | $3,850 | $15,410 |
| 2016 | $1,778 | $17,970 | $3,590 | $14,380 |
| 2015 | $1,639 | $17,330 | $3,460 | $13,870 |
Source: Public Records
Map
Nearby Homes
- 2636 S Honeysuckle Cir
- 7927 E Natal Ave
- 7937 E Monte Ave
- 7925 E Monte Ave
- 7918 E Nido Ave
- 7941 E Navarro Ave
- 7953 E Milagro Ave
- 7920 E Navarro Ave
- 7866 E Neville Ave
- 8041 E Meseto Ave
- 7842 E Navarro Ave
- 8162 E Neville Ave
- 8065 E Madero Ave
- 7811 E Navarro Ave
- 8230 E Navarro Ave
- 7859 E Madero Ave
- 7925 E Osage Ave
- 8016 E Medina Ave
- 7849 E Madero Ave
- 7832 E Osage Ave
- 2629 S Honeysuckle Cir
- 2617 S Honeysuckle Cir
- 2635 S Honeysuckle Cir
- 2624 S Honeysuckle Cir
- 2611 S Honeysuckle Cir
- 2630 S Honeysuckle Cir
- 2618 S Honeysuckle Cir
- 2612 S Honeysuckle Cir
- 2621 S Hibiscus
- 7955 E Natal Ave
- 7961 E Natal Ave
- 2627 S Hibiscus
- 8006 E Nido Ave
- 7951 E Natal Ave
- 7961 E Monte Ave
- 7955 E Monte Ave
- 2615 S Hibiscus
- 2633 S Hibiscus
- 7949 E Monte Ave
- 7947 E Natal Ave