
Seller's Agent in 2019
Angelica Silva
Colonial Investment Properties LLC
(305) 323-0248
34 Total Sales
Estimated Value: $402,000 - $445,000
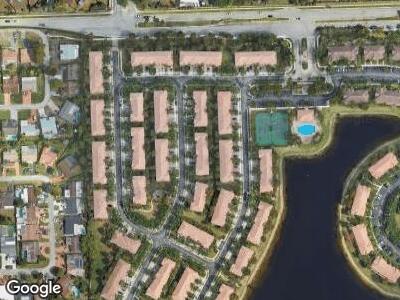
Spacious 3/2.5 townhouse in desirable Murano. Property features tiles throughout, updated kitchen with island connected to large family room, open patio, large master suite and bath with dual sinks, separate tub and shower, and roomy guest bedrooms. Murano offers charming community pool, gym, tennis courts, fenced children's play area, picnic area with gazebo, and walking trail surrounding lake.
| Date | Buyer | Sale Price | Title Company |
|---|---|---|---|
| Corporacion Hospitalaria Del | $170,100 | -- | |
| Murano At Hampton Park #4 Condominium As | -- | None Available | |
| Beecham Smith Beverly | $257,500 | -- |
| Date | Status | Borrower | Loan Amount |
|---|---|---|---|
| Previous Owner | Beecham Smith Beverly | $244,500 |
| Date | Event | Price | Change | Sq Ft Price |
|---|---|---|---|---|
| 02/01/2019 02/01/19 | Rented | $1,950 | 0.0% | -- |
| 12/27/2018 12/27/18 | Off Market | $1,950 | -- | -- |
| 12/06/2018 12/06/18 | For Rent | $1,950 | +2.6% | -- |
| 11/19/2016 11/19/16 | Rented | $1,900 | 0.0% | -- |
| 11/01/2016 11/01/16 | Under Contract | -- | -- | -- |
| 10/15/2016 10/15/16 | For Rent | $1,900 | -- | -- |
| Year | Tax Paid | Tax Assessment Tax Assessment Total Assessment is a certain percentage of the fair market value that is determined by local assessors to be the total taxable value of land and additions on the property. | Land | Improvement |
|---|---|---|---|---|
| 2025 | $7,062 | $337,870 | -- | -- |
| 2024 | $6,619 | $337,870 | -- | -- |
| 2023 | $6,619 | $279,240 | $0 | $0 |
| 2022 | $5,733 | $253,860 | $0 | $0 |
| 2021 | $5,168 | $230,790 | $23,080 | $207,710 |
| 2020 | $4,976 | $220,380 | $22,040 | $198,340 |
| 2019 | $4,854 | $211,680 | $21,170 | $190,510 |
| 2018 | $4,741 | $210,190 | $21,020 | $189,170 |
| 2017 | $4,344 | $193,600 | $0 | $0 |
| 2016 | $3,590 | $148,870 | $0 | $0 |
| 2015 | $3,436 | $135,340 | $0 | $0 |
| 2014 | $3,117 | $123,040 | $0 | $0 |
| 2013 | -- | $111,860 | $11,190 | $100,670 |
Seller's Agent in 2019
Angelica Silva
Colonial Investment Properties LLC
(305) 323-0248
34 Total Sales
Buyer's Agent in 2019
Irfan Abid, PA
Brokers Choice Realty Inc
(786) 473-3301
14 Total Sales
Buyer's Agent in 2016
Frank Pulles
Coldwell Banker Realty
(305) 962-6683
1 in this area
82 Total Sales