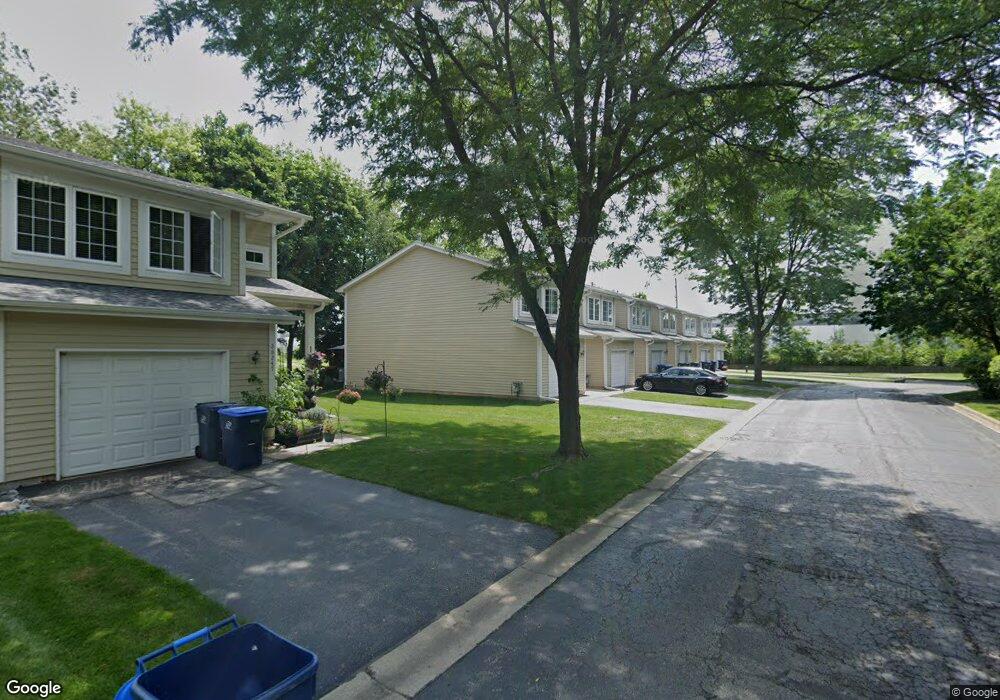
26235 N Green St Unit 3B Mundelein, IL 60060
Estimated Value: $248,320 - $299,000
--
Bed
2
Baths
1,404
Sq Ft
$198/Sq Ft
Est. Value
About This Home
This home is located at 26235 N Green St Unit 3B, Mundelein, IL 60060 and is currently estimated at $278,330, approximately $198 per square foot. 26235 N Green St Unit 3B is a home located in Lake County with nearby schools including Diamond Lake Elementary School, West Oak Middle School, and Mundelein Cons High School.
Ownership History
Date
Name
Owned For
Owner Type
Purchase Details
Closed on
Oct 3, 2006
Sold by
Aerrabotu Rajushekar
Bought by
Soni Pankaj N and Soni Bhavana P
Current Estimated Value
Home Financials for this Owner
Home Financials are based on the most recent Mortgage that was taken out on this home.
Original Mortgage
$146,400
Outstanding Balance
$89,891
Interest Rate
6.99%
Mortgage Type
Purchase Money Mortgage
Estimated Equity
$188,439
Purchase Details
Closed on
Jun 14, 2004
Sold by
Smolyar John and Vasiliev Rostislav
Bought by
Aerrabotu Rajashekar
Purchase Details
Closed on
May 12, 2004
Sold by
Smolyar John
Bought by
Smolyar John and Vasiliev Rostislav
Purchase Details
Closed on
Jul 7, 2000
Sold by
Branch Kenneth
Bought by
Kuo Susan
Home Financials for this Owner
Home Financials are based on the most recent Mortgage that was taken out on this home.
Original Mortgage
$98,000
Interest Rate
8.02%
Mortgage Type
Purchase Money Mortgage
Create a Home Valuation Report for This Property
The Home Valuation Report is an in-depth analysis detailing your home's value as well as a comparison with similar homes in the area
Home Values in the Area
Average Home Value in this Area
Purchase History
| Date | Buyer | Sale Price | Title Company |
|---|---|---|---|
| Soni Pankaj N | $183,000 | None Available | |
| Aerrabotu Rajashekar | -- | Fidelity National Title Insu | |
| Smolyar John | -- | Fidelity National Title Insu | |
| Kuo Susan | $122,500 | First American Title |
Source: Public Records
Mortgage History
| Date | Status | Borrower | Loan Amount |
|---|---|---|---|
| Open | Soni Pankaj N | $146,400 | |
| Previous Owner | Kuo Susan | $98,000 |
Source: Public Records
Tax History Compared to Growth
Tax History
| Year | Tax Paid | Tax Assessment Tax Assessment Total Assessment is a certain percentage of the fair market value that is determined by local assessors to be the total taxable value of land and additions on the property. | Land | Improvement |
|---|---|---|---|---|
| 2024 | $3,692 | $58,247 | $14,478 | $43,769 |
| 2023 | $3,566 | $53,724 | $13,354 | $40,370 |
| 2022 | $4,058 | $47,249 | $12,833 | $34,416 |
| 2021 | $3,892 | $46,232 | $12,557 | $33,675 |
| 2020 | $3,808 | $45,455 | $12,346 | $33,109 |
| 2019 | $4,318 | $45,023 | $12,229 | $32,794 |
| 2018 | $3,456 | $36,410 | $12,203 | $24,207 |
| 2017 | $3,400 | $35,261 | $11,818 | $23,443 |
| 2016 | $3,300 | $33,432 | $11,205 | $22,227 |
| 2015 | $3,234 | $31,248 | $10,473 | $20,775 |
| 2014 | $3,138 | $29,144 | $9,772 | $19,372 |
| 2012 | $3,983 | $32,062 | $9,857 | $22,205 |
Source: Public Records
Map
Nearby Homes
- 18838 W Hickory St
- 18804 W Hickory St
- 1651 Pauline Cir Unit 1
- 519 Jennifer Cir Unit 111
- 1544 Lakeridge Ct
- 26371 N Elmwood Ave
- 373 E Il Route 83
- 25861 N Arrowhead Dr
- 427 E Il Route 83
- 26325 N Walnut Ave
- 19330 W Lake View Ave
- 26346 N Walnut Ave
- MCKINLEY Plan at The Townes at Oak Creek
- GARFIELD Plan at The Townes at Oak Creek
- GREGORY Plan at The Townes at Oak Creek
- MONTGOMERY Plan at The Townes at Oak Creek
- 503 Acadia Ave
- 2016 Yellowstone Blvd
- 19451 W Hoag Ct
- 25707 N Eagle Dr
- 26241 N Green St Unit 3A
- 26229 N Green St Unit 3C
- 26223 N Green St Unit 3D
- 26253 N Green St Unit 2E
- 26217 N Green St Unit 3E
- 26259 N Green St Unit 2D
- 26211 N Green St Unit 3F
- 26211 N Green St Unit 2621
- 26265 N Green St Unit 2C
- 26271 N Green St Unit 2B
- 26277 N Green St Unit 2A
- 18860 W Rose Ave
- 26234 N Daisy Ln
- 26283 N Green St Unit 1E
- 26260 N Green St Unit 4D
- 26289 N Green St Unit 1D
- 26266 N Green St Unit 4C
- 26272 N Green St Unit 4B
- 26295 N Green St Unit 1C
- 26278 N Green St Unit 4A