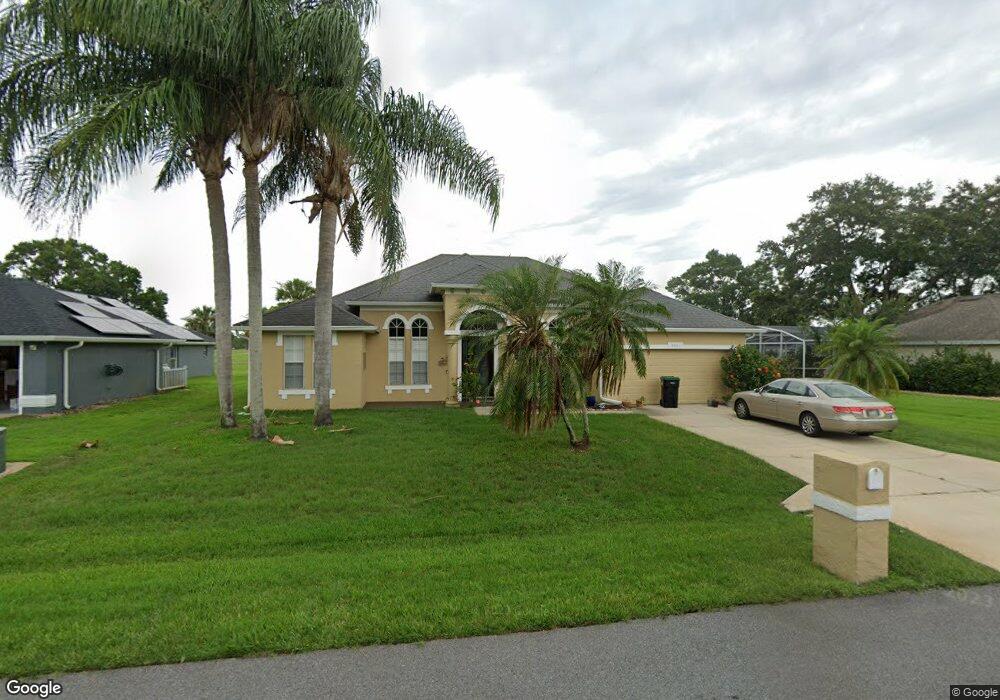
2624 Babbitt Ave Orlando, FL 32833
Estimated Value: $475,595 - $581,000
4
Beds
3
Baths
2,380
Sq Ft
$216/Sq Ft
Est. Value
About This Home
This home is located at 2624 Babbitt Ave, Orlando, FL 32833 and is currently estimated at $514,649, approximately $216 per square foot. 2624 Babbitt Ave is a home located in Orange County with nearby schools including Wedgefield School and East River High School.
Ownership History
Date
Name
Owned For
Owner Type
Purchase Details
Closed on
Nov 13, 2003
Sold by
Brunson Scott A and Brunson Barbara J
Bought by
Schulman Gary and Schulman Karyn L
Current Estimated Value
Home Financials for this Owner
Home Financials are based on the most recent Mortgage that was taken out on this home.
Original Mortgage
$190,400
Outstanding Balance
$75,888
Interest Rate
4%
Mortgage Type
Purchase Money Mortgage
Estimated Equity
$438,761
Purchase Details
Closed on
Dec 27, 2002
Sold by
Bay Pointe Homes Corp
Bought by
Brunson Scott A and Brunson Barbara J
Home Financials for this Owner
Home Financials are based on the most recent Mortgage that was taken out on this home.
Original Mortgage
$202,127
Interest Rate
5.92%
Mortgage Type
New Conventional
Purchase Details
Closed on
Jun 25, 2002
Sold by
Southeast Community Props Inc C
Bought by
Bay Pointe Homes Corp
Create a Home Valuation Report for This Property
The Home Valuation Report is an in-depth analysis detailing your home's value as well as a comparison with similar homes in the area
Home Values in the Area
Average Home Value in this Area
Purchase History
| Date | Buyer | Sale Price | Title Company |
|---|---|---|---|
| Schulman Gary | $238,900 | First American Title Ins Co | |
| Brunson Scott A | $202,200 | -- | |
| Bay Pointe Homes Corp | $22,500 | -- |
Source: Public Records
Mortgage History
| Date | Status | Borrower | Loan Amount |
|---|---|---|---|
| Open | Schulman Gary | $190,400 | |
| Previous Owner | Bay Pointe Homes Corp | $202,127 |
Source: Public Records
Tax History Compared to Growth
Tax History
| Year | Tax Paid | Tax Assessment Tax Assessment Total Assessment is a certain percentage of the fair market value that is determined by local assessors to be the total taxable value of land and additions on the property. | Land | Improvement |
|---|---|---|---|---|
| 2025 | $2,941 | $206,367 | -- | -- |
| 2024 | $2,732 | $200,551 | -- | -- |
| 2023 | $2,732 | $189,222 | $0 | $0 |
| 2022 | $2,624 | $183,711 | $0 | $0 |
| 2021 | $2,561 | $178,360 | $0 | $0 |
| 2020 | $2,435 | $175,897 | $0 | $0 |
| 2019 | $2,498 | $171,942 | $0 | $0 |
| 2018 | $2,475 | $168,736 | $0 | $0 |
| 2017 | $2,442 | $231,708 | $24,000 | $207,708 |
| 2016 | $2,413 | $224,594 | $23,000 | $201,594 |
| 2015 | $2,444 | $210,416 | $23,000 | $187,416 |
| 2014 | $2,493 | $181,473 | $23,000 | $158,473 |
Source: Public Records
Map
Nearby Homes
- 2797 Babbitt Ave
- 2827 Ballard Ave
- 0 Nettleton St Unit MFRO6367829
- 0 Netherland St Unit MFRO6314289
- 0 Babbitt Ave Unit MFRO6352786
- 20423 Melville St Unit 4
- 2601 Pine Glen Ct
- 2649 Albion Ave
- 20607 Newby St
- 2548 Albion Ave
- 20241 Maxim Pkwy Unit 4
- 2881 Lyndscape St
- 20610 Maxim Pkwy
- 2809 Lyndscape St
- 19603 Glen Elm Way
- 19552 Glen Elm Way
- 2350 Ardon Ave
- 2336 Ardon Ave Unit 4
- 2531 Lyndscape St
- 5028 Baker Ave
- 2630 Babbitt Ave
- 20405 Netherland St
- 2636 Babbitt Ave
- 2623 Babbitt Ave
- 20421 Netherland St
- 2615 Babbitt Ave
- 0 Netherland St Unit O4940235
- 0 Netherland St Unit S4812057
- Lot 6B Netherland St
- LOT 33 Netherland St
- 2637 Babbitt Ave
- 2642 Babbitt Ave
- 2781 Babbitt Ave
- 2611 Babbitt Ave
- 20429 Netherland St
- 20406 Netherland St
- 2763 Babbitt Ave Unit 6
- 2785 Babbitt Ave
- 20414 Netherland St
- 2759 Babbitt Ave