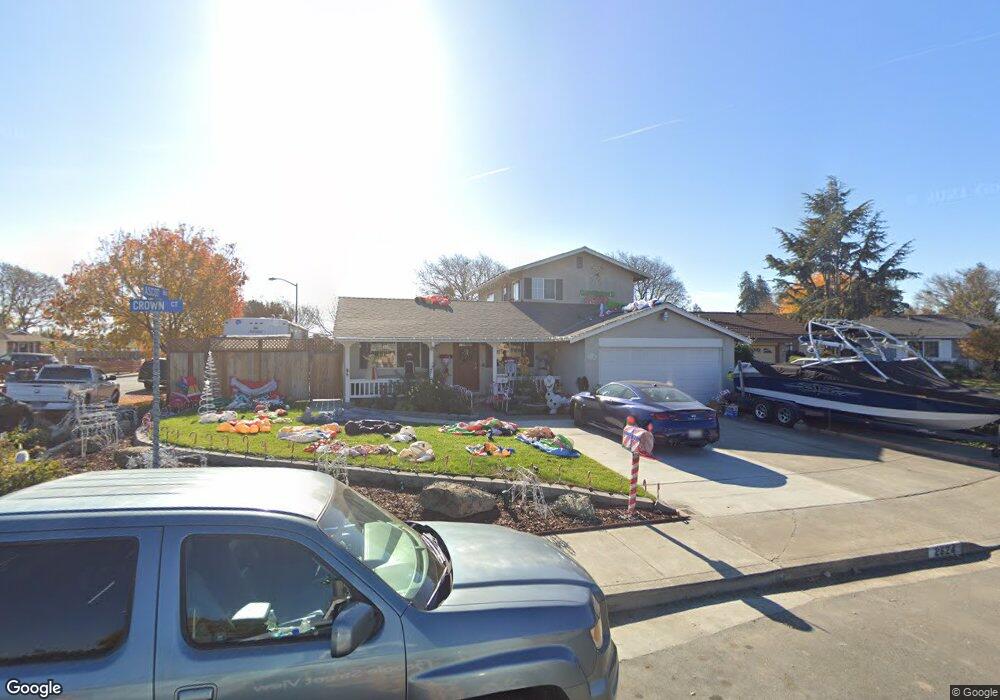
2624 Crown Ct Union City, CA 94587
Estimated Value: $1,342,000 - $1,886,000
3
Beds
3
Baths
2,192
Sq Ft
$724/Sq Ft
Est. Value
About This Home
This home is located at 2624 Crown Ct, Union City, CA 94587 and is currently estimated at $1,586,172, approximately $723 per square foot. 2624 Crown Ct is a home located in Alameda County with nearby schools including Tom Kitayama Elementary School, Itliong-Vera Cruz, and James Logan High School.
Ownership History
Date
Name
Owned For
Owner Type
Purchase Details
Closed on
Jan 29, 2024
Sold by
Ellis Lorrin G and Ellis Kelly S
Bought by
Ellis Trust and Ellis
Current Estimated Value
Purchase Details
Closed on
Feb 24, 2004
Sold by
Ellis Kelly S and Ellis Lorrin G
Bought by
Ellis Lorrin G and Ellis Kelly S
Home Financials for this Owner
Home Financials are based on the most recent Mortgage that was taken out on this home.
Original Mortgage
$323,500
Interest Rate
5.12%
Mortgage Type
Purchase Money Mortgage
Purchase Details
Closed on
May 30, 2002
Sold by
Alves Edward L and Alves Brenda K
Bought by
Souza Michael P and Souza Vicki A
Home Financials for this Owner
Home Financials are based on the most recent Mortgage that was taken out on this home.
Original Mortgage
$260,000
Interest Rate
6.83%
Create a Home Valuation Report for This Property
The Home Valuation Report is an in-depth analysis detailing your home's value as well as a comparison with similar homes in the area
Home Values in the Area
Average Home Value in this Area
Purchase History
| Date | Buyer | Sale Price | Title Company |
|---|---|---|---|
| Ellis Trust | -- | None Listed On Document | |
| Ellis Lorrin G | $324,000 | Alliance Title Company | |
| Souza Michael P | $375,000 | Fidelity National Title |
Source: Public Records
Mortgage History
| Date | Status | Borrower | Loan Amount |
|---|---|---|---|
| Previous Owner | Ellis Lorrin G | $323,500 | |
| Previous Owner | Souza Michael P | $260,000 | |
| Closed | Souza Michael P | $65,000 |
Source: Public Records
Tax History
| Year | Tax Paid | Tax Assessment Tax Assessment Total Assessment is a certain percentage of the fair market value that is determined by local assessors to be the total taxable value of land and additions on the property. | Land | Improvement |
|---|---|---|---|---|
| 2025 | $10,956 | $770,911 | $176,925 | $600,986 |
| 2024 | $10,956 | $755,660 | $173,456 | $589,204 |
| 2023 | $10,615 | $740,709 | $170,056 | $577,653 |
| 2022 | $10,435 | $726,050 | $166,722 | $566,328 |
| 2021 | $10,202 | $711,679 | $163,453 | $555,226 |
| 2020 | $10,015 | $711,313 | $161,778 | $549,535 |
| 2019 | $10,113 | $697,368 | $158,606 | $538,762 |
| 2018 | $9,880 | $683,697 | $155,497 | $528,200 |
| 2017 | $9,645 | $670,293 | $152,448 | $517,845 |
| 2016 | $9,295 | $657,152 | $149,459 | $507,693 |
| 2015 | $9,120 | $647,284 | $147,215 | $500,069 |
| 2014 | $8,779 | $634,607 | $144,331 | $490,276 |
Source: Public Records
Map
Nearby Homes
- 32262 Crest Ln
- 2473 Balmoral St
- 2447 Douglas St
- 2444 Douglas St
- 2449 Almaden Blvd
- 2432 Balmoral St
- 31262 San Andreas Dr
- 31286 Santa Rita Way
- 32368 Derby St
- 32224 Sloccum Ct
- 2826 Montair Way
- 3168 Courthouse Dr
- 32651 Singh Cir
- 32608 Brenda Way Unit 4
- 3138 Chimney Ct
- 31131 Alvarado Niles Rd
- 32625 Brenda Way Unit 1
- 3020 San Andreas Dr
- 32656 Brenda Way Unit 2
- 2676 Great Arbor Way Unit 45
- 2628 Crown Ct
- 2629 Ascot Way
- 2637 Ascot Way
- 2623 Ascot Way
- 2645 Ascot Way
- 2652 Crown Ct
- 2522 Carnoustie Ct
- 2636 Crown Ct
- 2520 Carnoustie Ct
- 2518 Carnoustie Ct
- 2648 Crown Ct
- 2651 Ascot Way
- 2640 Crown Ct
- 2511 Ascot Way
- 32221 Coronation Dr
- 32219 Coronation Dr
- 2644 Crown Ct
- 32217 Coronation Dr
- 2516 Carnoustie Ct
- 32223 Coronation Dr
Your Personal Tour Guide
Ask me questions while you tour the home.