
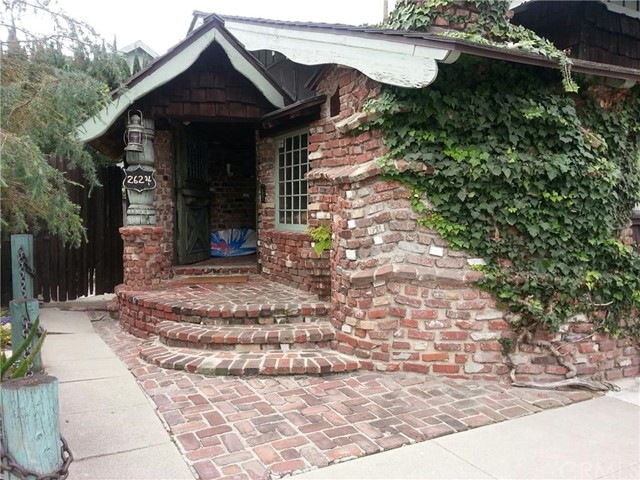
2624 E 8th St Long Beach, CA 90804
Rose Park Neighborhood
2
Beds
1
Bath
1,234
Sq Ft
3,152
Sq Ft Lot
Highlights
- No HOA
- Cooling Available
- 4-minute walk to Rose Park
- Woodrow Wilson High School Rated A
About This Home
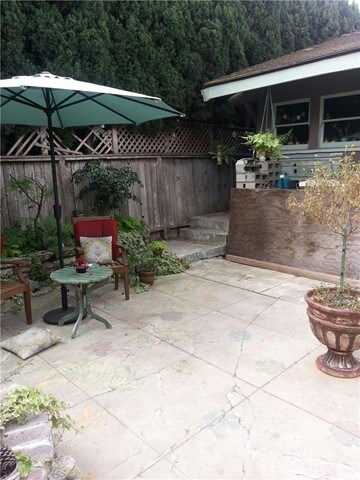
As of August 2023FIXER!!BRING YOUR INVESTORS AND CONTRACTORS!! This home has so much charm and potential but needs LOTS of TLC. Located in a quaint neighborhood close to elclectic shops, restaurants and the beach! Nice, low maintenance yard, perfect for entertaining!
Last Agent to Sell the Property
Estate Properties License #01110756 Listed on: 10/08/2015
Home Details
Home Type
- Single Family
Est. Annual Taxes
- $11,353
Year Built
- Built in 1919
Lot Details
- 3,152 Sq Ft Lot
- Value in Land
Parking
- 1 Car Garage
Interior Spaces
- 1,234 Sq Ft Home
- Living Room with Fireplace
Bedrooms and Bathrooms
- 2 Bedrooms
- 1 Full Bathroom
Utilities
- Cooling Available
Community Details
- No Home Owners Association
Listing and Financial Details
- Tax Lot 1
- Tax Tract Number 1
- Assessor Parcel Number 7262018031
Ownership History
Date
Name
Owned For
Owner Type
Purchase Details
Listed on
Jun 21, 2023
Closed on
Aug 7, 2023
Sold by
Atwood Trenton
Bought by
Pretsch Kyle T and Dawidziak Claire Walsh
Seller's Agent
Trent Atwood
Black Crown Realty
Buyer's Agent
Julie Christensen
Vista Sotheby’s International Realty
List Price
$799,000
Sold Price
$885,000
Premium/Discount to List
$86,000
10.76%
Views
95
Current Estimated Value
Home Financials for this Owner
Home Financials are based on the most recent Mortgage that was taken out on this home.
Estimated Appreciation
$75,202
Avg. Annual Appreciation
3.86%
Original Mortgage
$708,000
Outstanding Balance
$692,965
Interest Rate
6.71%
Mortgage Type
New Conventional
Estimated Equity
$264,251
Purchase Details
Closed on
Jul 12, 2019
Sold by
Atwood Annamarie
Bought by
Atwood Trenton
Purchase Details
Closed on
Dec 11, 2017
Sold by
Atwood Trenton C
Bought by
Atwood Trenton C and Atwood Annarnarie
Home Financials for this Owner
Home Financials are based on the most recent Mortgage that was taken out on this home.
Original Mortgage
$521,000
Interest Rate
3.94%
Mortgage Type
New Conventional
Purchase Details
Listed on
Jan 20, 2016
Closed on
Apr 11, 2016
Sold by
Valley Property Investors Llc
Bought by
Atwood Trenton Clark and Atwood Annamarie
Seller's Agent
Billy Larsen
Real Broker
Buyer's Agent
Kelly Laule
Better Living SoCal
List Price
$569,000
Sold Price
$560,000
Premium/Discount to List
-$9,000
-1.58%
Home Financials for this Owner
Home Financials are based on the most recent Mortgage that was taken out on this home.
Avg. Annual Appreciation
5.93%
Original Mortgage
$526,572
Interest Rate
3.59%
Mortgage Type
VA
Purchase Details
Listed on
Oct 8, 2015
Closed on
Oct 21, 2015
Sold by
Zweibel Michael
Bought by
Valley Property Investors Llc
Seller's Agent
Sherry LaMaison
Estate Properties
Buyer's Agent
Billy Larsen
Real Broker
List Price
$404,000
Sold Price
$427,000
Premium/Discount to List
$23,000
5.69%
Home Financials for this Owner
Home Financials are based on the most recent Mortgage that was taken out on this home.
Avg. Annual Appreciation
63.72%
Purchase Details
Closed on
Aug 12, 2003
Sold by
Walker Glenn
Bought by
Walker Milton Glenn and The Milton Glenn Walker Trust
Similar Homes in the area
Create a Home Valuation Report for This Property
The Home Valuation Report is an in-depth analysis detailing your home's value as well as a comparison with similar homes in the area
Home Values in the Area
Average Home Value in this Area
Purchase History
| Date | Type | Sale Price | Title Company |
|---|---|---|---|
| Grant Deed | $885,000 | First American Title Insurance | |
| Quit Claim Deed | $80,000 | None Available | |
| Interfamily Deed Transfer | -- | Pacific Coast Title | |
| Grant Deed | $560,000 | Progressive | |
| Grant Deed | $427,000 | Progressive | |
| Quit Claim Deed | -- | -- |
Source: Public Records
Mortgage History
| Date | Status | Loan Amount | Loan Type |
|---|---|---|---|
| Open | $708,000 | New Conventional | |
| Previous Owner | $510,000 | New Conventional | |
| Previous Owner | $521,000 | New Conventional | |
| Previous Owner | $526,572 | VA | |
| Previous Owner | $5,000,000 | Credit Line Revolving | |
| Previous Owner | $502,500 | Reverse Mortgage Home Equity Conversion Mortgage |
Source: Public Records
Property History
| Date | Event | Price | Change | Sq Ft Price |
|---|---|---|---|---|
| 08/10/2023 08/10/23 | Sold | $885,000 | +10.8% | $717 / Sq Ft |
| 07/01/2023 07/01/23 | Pending | -- | -- | -- |
| 06/21/2023 06/21/23 | For Sale | $799,000 | +42.7% | $647 / Sq Ft |
| 05/19/2016 05/19/16 | Sold | $560,000 | -1.6% | $454 / Sq Ft |
| 05/05/2016 05/05/16 | Pending | -- | -- | -- |
| 05/02/2016 05/02/16 | For Sale | $569,000 | 0.0% | $461 / Sq Ft |
| 04/06/2016 04/06/16 | Pending | -- | -- | -- |
| 04/06/2016 04/06/16 | Price Changed | $569,000 | -1.7% | $461 / Sq Ft |
| 03/22/2016 03/22/16 | Price Changed | $579,000 | -1.0% | $469 / Sq Ft |
| 03/15/2016 03/15/16 | Price Changed | $585,000 | -0.7% | $474 / Sq Ft |
| 03/09/2016 03/09/16 | Price Changed | $589,000 | -1.0% | $477 / Sq Ft |
| 02/15/2016 02/15/16 | Price Changed | $594,999 | -2.5% | $482 / Sq Ft |
| 01/20/2016 01/20/16 | For Sale | $610,000 | +42.9% | $494 / Sq Ft |
| 10/30/2015 10/30/15 | Sold | $427,000 | +5.7% | $346 / Sq Ft |
| 10/15/2015 10/15/15 | Pending | -- | -- | -- |
| 10/08/2015 10/08/15 | For Sale | $404,000 | -- | $327 / Sq Ft |
Source: California Regional Multiple Listing Service (CRMLS)
Tax History Compared to Growth
Tax History
| Year | Tax Paid | Tax Assessment Tax Assessment Total Assessment is a certain percentage of the fair market value that is determined by local assessors to be the total taxable value of land and additions on the property. | Land | Improvement |
|---|---|---|---|---|
| 2025 | $11,353 | $902,700 | $646,782 | $255,918 |
| 2024 | $11,353 | $885,000 | $634,100 | $250,900 |
| 2023 | $8,209 | $637,178 | $509,745 | $127,433 |
| 2022 | $7,702 | $624,685 | $499,750 | $124,935 |
| 2021 | $7,550 | $612,437 | $489,951 | $122,486 |
| 2019 | $7,440 | $594,274 | $475,420 | $118,854 |
| 2018 | $7,221 | $582,623 | $466,099 | $116,524 |
| 2017 | $7,143 | $571,200 | $456,960 | $114,240 |
| 2016 | $5,184 | $427,000 | $341,600 | $85,400 |
| 2015 | $2,272 | $187,295 | $118,456 | $68,839 |
| 2014 | $2,260 | $183,627 | $116,136 | $67,491 |
Source: Public Records
Agents Affiliated with this Home
-
Trent Atwood
T
Seller's Agent in 2023
Trent Atwood
Black Crown Realty
(310) 982-7055
1 in this area
2 Total Sales
-
Julie Christensen
Buyer's Agent in 2023
Julie Christensen
Vista Sotheby’s International Realty
(310) 874-2886
1 in this area
31 Total Sales
-
Billy Larsen
Seller's Agent in 2016
Billy Larsen
Real Broker
(949) 533-6648
83 Total Sales
-
Kelly Laule
Buyer's Agent in 2016
Kelly Laule
Better Living SoCal
(714) 376-0212
86 Total Sales
-
Sherry LaMaison
Seller's Agent in 2015
Sherry LaMaison
RE/MAX
(310) 849-6539
32 Total Sales
Map
Source: California Regional Multiple Listing Service (CRMLS)
MLS Number: SB15222479
APN: 7262-018-031
Disclaimer: Certain information contained herein is derived from information provided by parties other than Homes.com. All information provided is deemed reliable, but is not guaranteed to be accurate and should be independently verified.
![]() The multiple listing data appearing on this website, or contained in reports produced therefrom, is owned and copyrighted by California Regional Multiple Listing Service, Inc. ("CRMLS") and is protected by all applicable copyright laws. Information provided is for viewer's personal, non-commercial use and may not be used for any purpose other than to identify prospective properties the viewer may be interested in purchasing. All listing data, including but not limited to square footage and lot size is believed to be accurate, but the listing Agent, listing Broker and CRMLS and its affiliates do not warrant or guarantee such accuracy. The viewer should independently verify the listed data prior to making any decisions based on such information by personal inspection and/or contacting a real estate professional.
The multiple listing data appearing on this website, or contained in reports produced therefrom, is owned and copyrighted by California Regional Multiple Listing Service, Inc. ("CRMLS") and is protected by all applicable copyright laws. Information provided is for viewer's personal, non-commercial use and may not be used for any purpose other than to identify prospective properties the viewer may be interested in purchasing. All listing data, including but not limited to square footage and lot size is believed to be accurate, but the listing Agent, listing Broker and CRMLS and its affiliates do not warrant or guarantee such accuracy. The viewer should independently verify the listed data prior to making any decisions based on such information by personal inspection and/or contacting a real estate professional.
Based on information from California Regional Multiple Listing Service, Inc. and /or other sources. All data, including all measurements and calculations of area, is obtained from various sources and has not been, and will not be, verified by broker or MLS. All information should be independently reviewed and verified for accuracy. Properties may or may not be listed by the office/agent presenting the information
Nearby Homes
- 2703 E 7th St
- 776 Stanley Ave
- 2521 E 7th St
- 744 Gladys Ave
- 2415 E 7th St
- 1012 Temple Ave
- 938 Stanley Ave
- 767 Freeman Ave
- 1035 Ohio Ave
- 916 Junipero Ave
- 602 Stanley Ave
- 1050 Molino Ave
- 2815 E 5th St
- 508 Molino Ave
- 1055 Orizaba Ave Unit 6
- 1055 Orizaba Ave Unit 3
- 1073 Orizaba Ave
- 1110 Ohio Ave Unit 107
- 1121 Gladys Ave
- 660 Obispo Ave