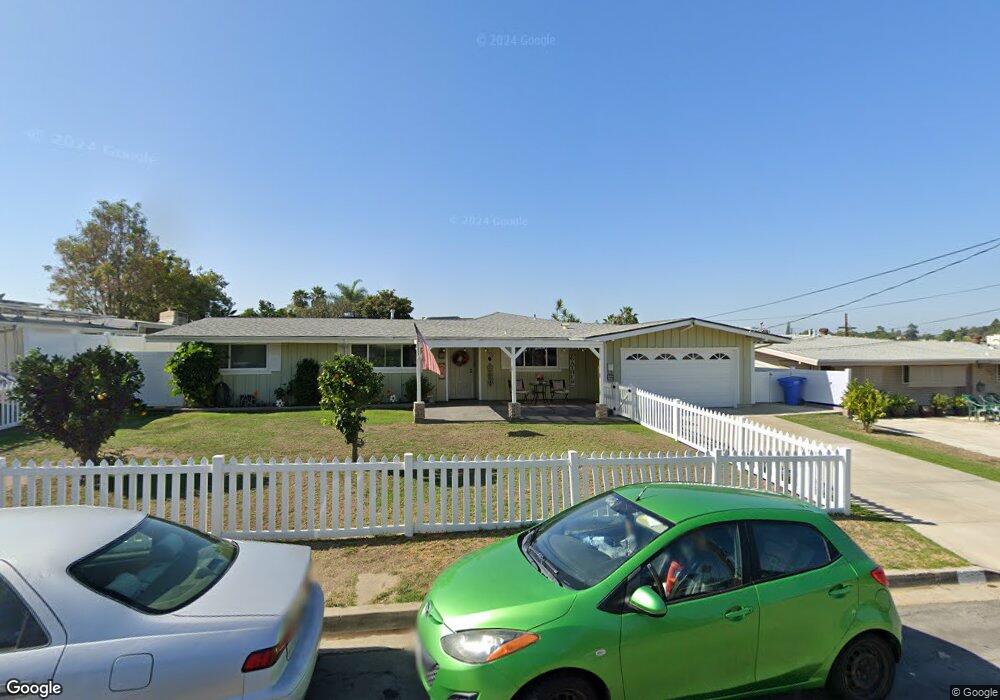
2624 Nida Place Lemon Grove, CA 91945
Estimated Value: $697,182 - $762,000
3
Beds
2
Baths
1,567
Sq Ft
$470/Sq Ft
Est. Value
About This Home
This home is located at 2624 Nida Place, Lemon Grove, CA 91945 and is currently estimated at $736,296, approximately $469 per square foot. 2624 Nida Place is a home located in San Diego County with nearby schools including Mount Miguel High School, Saint John Of The Cross Catholic School, and Lighthouse Christian Academy.
Ownership History
Date
Name
Owned For
Owner Type
Purchase Details
Closed on
Apr 25, 2014
Sold by
Mcfadden Kamil and Mcfadden Annette M
Bought by
Mcfadden Kamil and Mcfadden Annette M
Current Estimated Value
Home Financials for this Owner
Home Financials are based on the most recent Mortgage that was taken out on this home.
Original Mortgage
$225,300
Outstanding Balance
$170,882
Interest Rate
4.28%
Mortgage Type
New Conventional
Estimated Equity
$565,414
Purchase Details
Closed on
Sep 6, 2011
Sold by
Edgil James Bryce and Edgil Eva
Bought by
Mcfadden Kamil and Edgil Annette
Home Financials for this Owner
Home Financials are based on the most recent Mortgage that was taken out on this home.
Original Mortgage
$228,068
Interest Rate
4.25%
Mortgage Type
FHA
Purchase Details
Closed on
Jun 12, 1997
Sold by
Edgil James Bryce
Bought by
Edgil James Bryce and Edgil Eva
Create a Home Valuation Report for This Property
The Home Valuation Report is an in-depth analysis detailing your home's value as well as a comparison with similar homes in the area
Home Values in the Area
Average Home Value in this Area
Purchase History
| Date | Buyer | Sale Price | Title Company |
|---|---|---|---|
| Mcfadden Kamil | -- | Orange Coast Title Company | |
| Mcfadden Kamil | $234,000 | Lawyers Title Company | |
| Edgil James Bryce | -- | -- |
Source: Public Records
Mortgage History
| Date | Status | Borrower | Loan Amount |
|---|---|---|---|
| Open | Mcfadden Kamil | $225,300 | |
| Previous Owner | Mcfadden Kamil | $228,068 |
Source: Public Records
Tax History Compared to Growth
Tax History
| Year | Tax Paid | Tax Assessment Tax Assessment Total Assessment is a certain percentage of the fair market value that is determined by local assessors to be the total taxable value of land and additions on the property. | Land | Improvement |
|---|---|---|---|---|
| 2025 | $4,544 | $328,039 | $125,599 | $202,440 |
| 2024 | $4,544 | $321,608 | $123,137 | $198,471 |
| 2023 | $4,433 | $315,303 | $120,723 | $194,580 |
| 2022 | $4,411 | $309,121 | $118,356 | $190,765 |
| 2021 | $4,355 | $303,061 | $116,036 | $187,025 |
| 2020 | $4,303 | $299,955 | $114,847 | $185,108 |
| 2019 | $4,151 | $0 | $0 | $0 |
| 2018 | $4,151 | $288,310 | $110,389 | $177,921 |
| 2017 | $3,729 | $253,246 | $108,225 | $145,021 |
| 2016 | $3,596 | $248,281 | $106,103 | $142,178 |
| 2015 | $3,575 | $244,553 | $104,510 | $140,043 |
| 2014 | $3,441 | $239,763 | $102,463 | $137,300 |
Source: Public Records
Map
Nearby Homes
- 2674 Buena Vista Ave
- 2985 New Jersey Ave
- 3195 Buena Vista Ave
- 2030 Fairhaven St
- 7406 Roosevelt Ave
- 1915 Englewood Dr
- 2240-42 El Prado Ave
- 7423 Daytona St
- 2108 El Prado Ave
- 8154 Golden Ave
- 1928 Noble St
- 8046-48 Sarawak Dr
- 8156 Golden Ave
- 8160 Golden Ave
- 8170 Golden Ave
- 8164 Golden Ave
- 8172 Golden Ave
- 8178 Golden Ave
- 8174 Golden Ave
- 8176 Golden Ave
- 2630 Nida Place
- 2618 Nida Place
- 2675 Citronella Ave
- 2655 Citronella Ave Unit 57
- 2625 Nida Place
- 2636 Nida Place
- 2631 Nida Place
- 2619 Nida Place
- 2679 Citronella Ave Unit 81
- 2612 Nida Place
- 7815 Palm St
- 2635 Citronella Ave
- 7811 Palm St
- 2629 Citronella Ave
- 2637 Nida Place
- 2613 Nida Place
- 2619 Citronella Ave Unit 21
- 7805 Palm St
- 2606 Nida Place
- 7877 Palm St