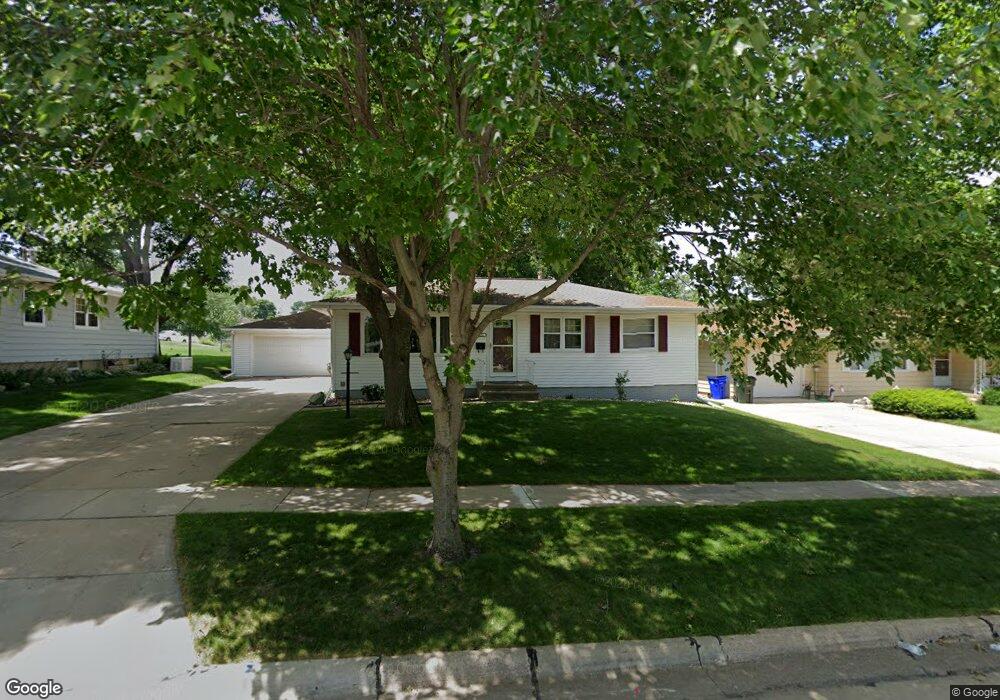
2624 Southland St SW Cedar Rapids, IA 52404
Southwest Area NeighborhoodEstimated Value: $211,000 - $219,000
3
Beds
2
Baths
1,066
Sq Ft
$202/Sq Ft
Est. Value
About This Home
This home is located at 2624 Southland St SW, Cedar Rapids, IA 52404 and is currently estimated at $215,283, approximately $201 per square foot. 2624 Southland St SW is a home located in Linn County with nearby schools including Junction City Elementary School, Grant Elementary School, and Bruce Hall Day Treatment Center.
Ownership History
Date
Name
Owned For
Owner Type
Purchase Details
Closed on
Jun 11, 2021
Sold by
Stepanek Jason T and Barber Brittany
Bought by
Anson Brittany and Anson Ian
Current Estimated Value
Home Financials for this Owner
Home Financials are based on the most recent Mortgage that was taken out on this home.
Original Mortgage
$140,000
Outstanding Balance
$126,753
Interest Rate
2.9%
Mortgage Type
New Conventional
Estimated Equity
$88,530
Purchase Details
Closed on
Aug 23, 2017
Sold by
Akerberg Brian C and Akerberg Jennifer J
Bought by
Stepanek Jason T
Home Financials for this Owner
Home Financials are based on the most recent Mortgage that was taken out on this home.
Original Mortgage
$116,000
Interest Rate
3.92%
Mortgage Type
New Conventional
Purchase Details
Closed on
Jul 13, 2009
Sold by
Estate Of Frances F Daly
Bought by
Akerberg Brian C and Hess Jennifer J
Home Financials for this Owner
Home Financials are based on the most recent Mortgage that was taken out on this home.
Original Mortgage
$130,591
Interest Rate
5.49%
Mortgage Type
FHA
Create a Home Valuation Report for This Property
The Home Valuation Report is an in-depth analysis detailing your home's value as well as a comparison with similar homes in the area
Home Values in the Area
Average Home Value in this Area
Purchase History
| Date | Buyer | Sale Price | Title Company |
|---|---|---|---|
| Anson Brittany | $180,000 | None Available | |
| Stepanek Jason T | -- | None Available | |
| Akerberg Brian C | $132,500 | None Available |
Source: Public Records
Mortgage History
| Date | Status | Borrower | Loan Amount |
|---|---|---|---|
| Open | Anson Brittany | $140,000 | |
| Previous Owner | Stepanek Jason T | $116,000 | |
| Previous Owner | Akerberg Brian C | $130,591 |
Source: Public Records
Tax History Compared to Growth
Tax History
| Year | Tax Paid | Tax Assessment Tax Assessment Total Assessment is a certain percentage of the fair market value that is determined by local assessors to be the total taxable value of land and additions on the property. | Land | Improvement |
|---|---|---|---|---|
| 2025 | $3,344 | $198,200 | $39,300 | $158,900 |
| 2024 | $3,182 | $200,600 | $39,300 | $161,300 |
| 2023 | $3,182 | $199,400 | $39,300 | $160,100 |
| 2022 | $3,122 | $159,700 | $31,800 | $127,900 |
| 2021 | $3,210 | $159,700 | $31,800 | $127,900 |
| 2020 | $3,210 | $154,100 | $30,000 | $124,100 |
| 2019 | $2,748 | $136,000 | $30,000 | $106,000 |
| 2018 | $2,424 | $136,000 | $30,000 | $106,000 |
| 2017 | $2,540 | $122,400 | $30,000 | $92,400 |
| 2016 | $2,540 | $119,500 | $30,000 | $89,500 |
| 2015 | $2,550 | $119,824 | $29,952 | $89,872 |
| 2014 | $2,550 | $122,724 | $29,952 | $92,772 |
| 2013 | $2,556 | $122,724 | $29,952 | $92,772 |
Source: Public Records
Map
Nearby Homes
- 2818 Southland St SW
- 2601 Teresa Dr SW
- 2401 Victoria Dr SW
- 90 29th Ave SW
- 109 Evelyn Dr SW
- 2937 Southland St SW
- 186 22nd Ave SW
- 51 29th Avenue Dr SW Unit D11
- 51 29th Avenue Dr SW Unit C22
- 3010 Bowling St SW
- 2955 Bowling St SW Unit E238
- 2021 Hamilton St SW
- 2321 Lauren Dr SW
- 42 Park Village Ave SW
- 3212 Southland St SW
- 2212 Deborah Dr SW
- 9 33rd Ave SW
- 148 33rd Ave SW
- 2536 L St SW
- 1804 I St SW
- 2618 Southland St SW
- 2704 Southland St SW
- 2612 Southland St SW
- 2619 Southland St SW
- 2705 Southland St SW
- 2716 Southland St SW
- 29 26th Ave SW
- 33 26th Ave SW
- 2613 Southland St SW
- 2711 Southland St SW
- 25 26th Ave SW
- 2611 Schaeffer Dr SW
- 37 26th Ave SW
- 2615 Schaeffer Dr SW
- 2722 Southland St SW
- 2607 Schaeffer Dr SW
- 2717 Southland St SW
- 20 27th Ave SW
- 19 27th Ave SW
- 2635 Schaeffer Dr SW