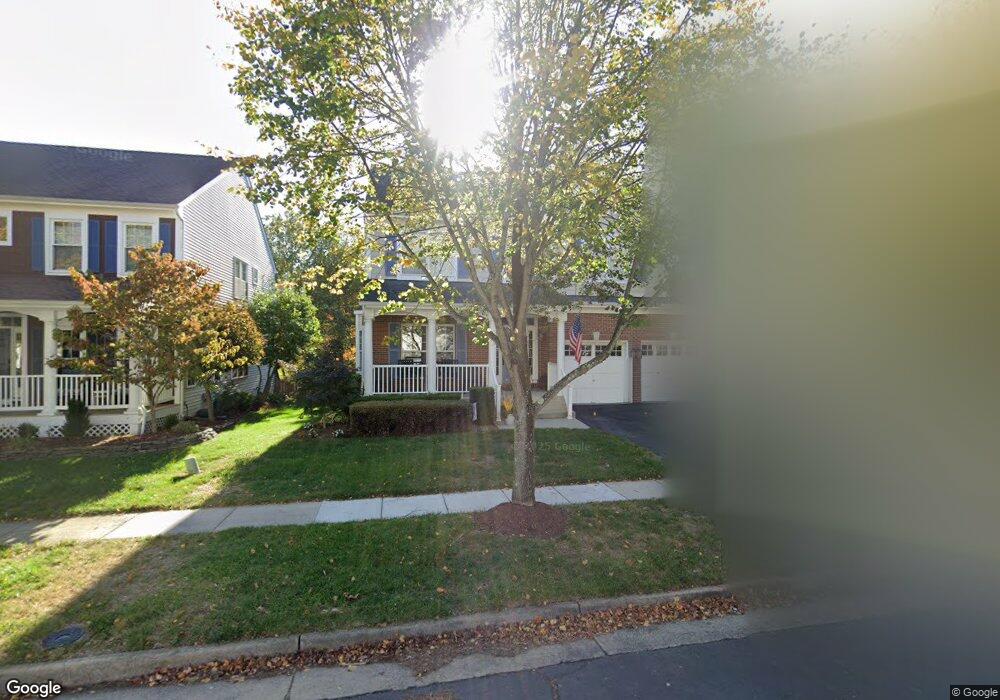
26246 Ocala Cir Chantilly, VA 20152
Estimated Value: $917,000 - $1,005,000
5
Beds
4
Baths
3,746
Sq Ft
$258/Sq Ft
Est. Value
About This Home
This home is located at 26246 Ocala Cir, Chantilly, VA 20152 and is currently estimated at $966,663, approximately $258 per square foot. 26246 Ocala Cir is a home located in Loudoun County with nearby schools including Little River Elementary School, J. Michael Lunsford Middle School, and Freedom High School.
Ownership History
Date
Name
Owned For
Owner Type
Purchase Details
Closed on
Nov 14, 2020
Sold by
Burns Brian Robert and Burns Yvonne Lyonne
Bought by
Burns Brian Robert and Burns Yvonne Lynette
Current Estimated Value
Purchase Details
Closed on
Jul 23, 2020
Sold by
Burns Brian Robert and Burns Yvonne Lynette
Bought by
Burns Brian Robert and Burns Yvonne Lynette
Purchase Details
Closed on
Nov 28, 2014
Sold by
Burns Brian R and Burns Yvonne L
Bought by
Burns Trustee Brian R
Purchase Details
Closed on
Jul 24, 2009
Sold by
Jalufka Paul E
Bought by
Burns Brian R
Home Financials for this Owner
Home Financials are based on the most recent Mortgage that was taken out on this home.
Original Mortgage
$380,800
Interest Rate
5.58%
Mortgage Type
New Conventional
Purchase Details
Closed on
Jul 13, 2004
Sold by
Gomes Eldio
Bought by
Jalufka Paul E
Home Financials for this Owner
Home Financials are based on the most recent Mortgage that was taken out on this home.
Original Mortgage
$470,000
Interest Rate
6.32%
Mortgage Type
New Conventional
Create a Home Valuation Report for This Property
The Home Valuation Report is an in-depth analysis detailing your home's value as well as a comparison with similar homes in the area
Home Values in the Area
Average Home Value in this Area
Purchase History
| Date | Buyer | Sale Price | Title Company |
|---|---|---|---|
| Burns Brian Robert | -- | None Available | |
| Burns Brian Robert | -- | None Available | |
| Burns Trustee Brian R | -- | -- | |
| Burns Brian R | $476,000 | -- | |
| Jalufka Paul E | $600,000 | -- |
Source: Public Records
Mortgage History
| Date | Status | Borrower | Loan Amount |
|---|---|---|---|
| Previous Owner | Burns Brian R | $380,800 | |
| Previous Owner | Jalufka Paul E | $470,000 |
Source: Public Records
Tax History Compared to Growth
Tax History
| Year | Tax Paid | Tax Assessment Tax Assessment Total Assessment is a certain percentage of the fair market value that is determined by local assessors to be the total taxable value of land and additions on the property. | Land | Improvement |
|---|---|---|---|---|
| 2025 | $7,192 | $893,360 | $296,700 | $596,660 |
| 2024 | $7,446 | $860,760 | $296,700 | $564,060 |
| 2023 | $6,956 | $794,930 | $271,700 | $523,230 |
| 2022 | $6,772 | $760,870 | $241,700 | $519,170 |
| 2021 | $6,496 | $662,850 | $211,700 | $451,150 |
| 2020 | $6,403 | $618,620 | $196,700 | $421,920 |
| 2019 | $6,380 | $610,570 | $196,700 | $413,870 |
| 2018 | $6,257 | $576,670 | $176,700 | $399,970 |
| 2017 | $6,183 | $549,630 | $176,700 | $372,930 |
| 2016 | $6,155 | $537,570 | $0 | $0 |
| 2015 | $6,179 | $367,710 | $0 | $367,710 |
| 2014 | $6,261 | $365,390 | $0 | $365,390 |
Source: Public Records
Map
Nearby Homes
- 26071 Nimbleton Square
- 26134 Lands End Dr
- 43438 Oxen Ln
- 26139 Lands End Dr
- 4628 Fairfax Manor Ct
- 43454 Laidlow St
- 26110 Lands End Dr
- 43438 Mink Meadows St
- 4621 Fairfax Manor Ct
- 4620 Pleasant Valley Rd
- 25897 Flintonbridge Dr
- 0 Fairfax Manor Ct Unit VAFX2160912
- 25872 Flintonbridge Dr
- 4610 Fairfax Manor Ct
- 0 Pleasant Valley Rd Unit VAFX2264140
- 0 Pleasant Valley Rd Unit VAFX2264084
- Lot 72A Loudoun Fairfax Line
- 4622 Fairfax Manor Ct
- 4616 Fairfax Manor Ct
- 4615 Fairfax Manor Ct
- 26250 Ocala Cir
- 26242 Ocala Cir
- 26238 Ocala Cir
- 26254 Ocala Cir
- 26234 Ocala Cir
- 26247 Ocala Cir
- 26258 Ocala Cir
- 26243 Ocala Cir
- 26251 Ocala Cir
- 26255 Ocala Cir
- 26239 Ocala Cir
- 26259 Ocala Cir
- 26230 Ocala Cir
- 26262 Ocala Cir
- 26235 Ocala Cir
- 26263 Ocala Cir
- 26226 Ocala Cir
- 26266 Ocala Cir
- 26112 Flintonbridge Dr
- 26108 Flintonbridge Dr