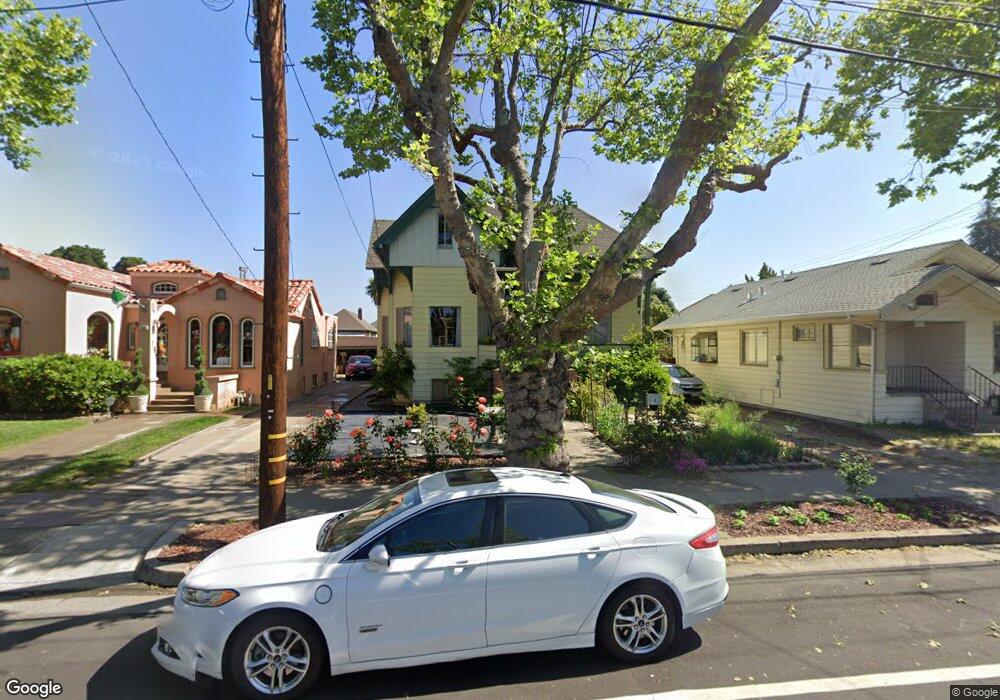
2625 Central Ave Alameda, CA 94501
Downtown Alameda NeighborhoodEstimated Value: $998,000 - $1,801,000
4
Beds
2
Baths
2,133
Sq Ft
$688/Sq Ft
Est. Value
About This Home
This home is located at 2625 Central Ave, Alameda, CA 94501 and is currently estimated at $1,467,627, approximately $688 per square foot. 2625 Central Ave is a home located in Alameda County with nearby schools including Edison Elementary School, Lincoln Middle School, and Alameda High School.
Ownership History
Date
Name
Owned For
Owner Type
Purchase Details
Closed on
Aug 10, 2011
Sold by
Hansen Janiese
Bought by
Hansen Douglas Rhett
Current Estimated Value
Home Financials for this Owner
Home Financials are based on the most recent Mortgage that was taken out on this home.
Original Mortgage
$484,800
Outstanding Balance
$335,043
Interest Rate
4.53%
Mortgage Type
FHA
Estimated Equity
$1,132,584
Purchase Details
Closed on
Aug 9, 2011
Sold by
Lefevre Shonna Lynn R and Lefevre Robert R
Bought by
Hansen Douglas Rhett
Home Financials for this Owner
Home Financials are based on the most recent Mortgage that was taken out on this home.
Original Mortgage
$484,800
Outstanding Balance
$335,043
Interest Rate
4.53%
Mortgage Type
FHA
Estimated Equity
$1,132,584
Purchase Details
Closed on
Feb 14, 1995
Sold by
Lefevre Bob L and Lefevre Gloria
Bought by
Lefevre Robert R and Lefevre Gloria M
Create a Home Valuation Report for This Property
The Home Valuation Report is an in-depth analysis detailing your home's value as well as a comparison with similar homes in the area
Home Values in the Area
Average Home Value in this Area
Purchase History
| Date | Buyer | Sale Price | Title Company |
|---|---|---|---|
| Hansen Douglas Rhett | -- | Fidelity National Title Co | |
| Hansen Douglas Rhett | $470,000 | Fidelity National Title Co | |
| Lefevre Robert R | -- | -- |
Source: Public Records
Mortgage History
| Date | Status | Borrower | Loan Amount |
|---|---|---|---|
| Open | Hansen Douglas Rhett | $484,800 |
Source: Public Records
Tax History
| Year | Tax Paid | Tax Assessment Tax Assessment Total Assessment is a certain percentage of the fair market value that is determined by local assessors to be the total taxable value of land and additions on the property. | Land | Improvement |
|---|---|---|---|---|
| 2025 | $9,543 | $590,314 | $177,094 | $413,220 |
| 2024 | $9,543 | $578,743 | $173,623 | $405,120 |
| 2023 | $9,203 | $567,397 | $170,219 | $397,178 |
| 2022 | $9,006 | $556,272 | $166,881 | $389,391 |
| 2021 | $8,801 | $545,368 | $163,610 | $381,758 |
| 2020 | $8,699 | $539,780 | $161,934 | $377,846 |
| 2019 | $8,015 | $529,200 | $158,760 | $370,440 |
| 2018 | $7,822 | $518,827 | $155,648 | $363,179 |
| 2017 | $7,483 | $508,657 | $152,597 | $356,060 |
| 2016 | $7,486 | $498,683 | $149,605 | $349,078 |
| 2015 | $7,459 | $491,196 | $147,359 | $343,837 |
| 2014 | $7,091 | $481,575 | $144,472 | $337,103 |
Source: Public Records
Map
Nearby Homes
- 2608 Central Ave
- 1416 Versailles Ave
- 2515 Central Ave Unit 203
- 1601 Broadway Unit 9
- 2417 Marti Rae Ct
- 1241 Park Ave
- 1308 Court St
- 1251 Park St
- 2312 San Antonio Ave
- 1611 Lea Ct
- 976 Park St
- 1100 Park Ave
- 954 Park St
- 3248 Briggs Ave
- 2932 Marina Dr
- 2853 Regatta Dr Unit 179
- 2136 Pacific Ave
- 2875 Glascock St Unit 209
- 340 29th Ave Unit 207
- 340 29th Ave Unit 204
- 2621 Central Ave
- 2629 Central Ave
- 1407 Pearl St
- 1411 Pearl St
- 2633 Central Ave
- 2613 Central Ave
- 2630 Central Ave
- 2626 Santa Clara Ave
- 2701 Central Ave
- 2609 Central Ave
- 2620 Santa Clara Ave
- 1419 Pearl St
- 2618 Santa Clara Ave
- 1379 Pearl St
- 1410 Pearl St
- 2705 Central Ave
- 2612 Santa Clara Ave Unit C
- 2612 Santa Clara Ave Unit D
- 1414 Pearl St
- 1410 Broadway
Your Personal Tour Guide
Ask me questions while you tour the home.