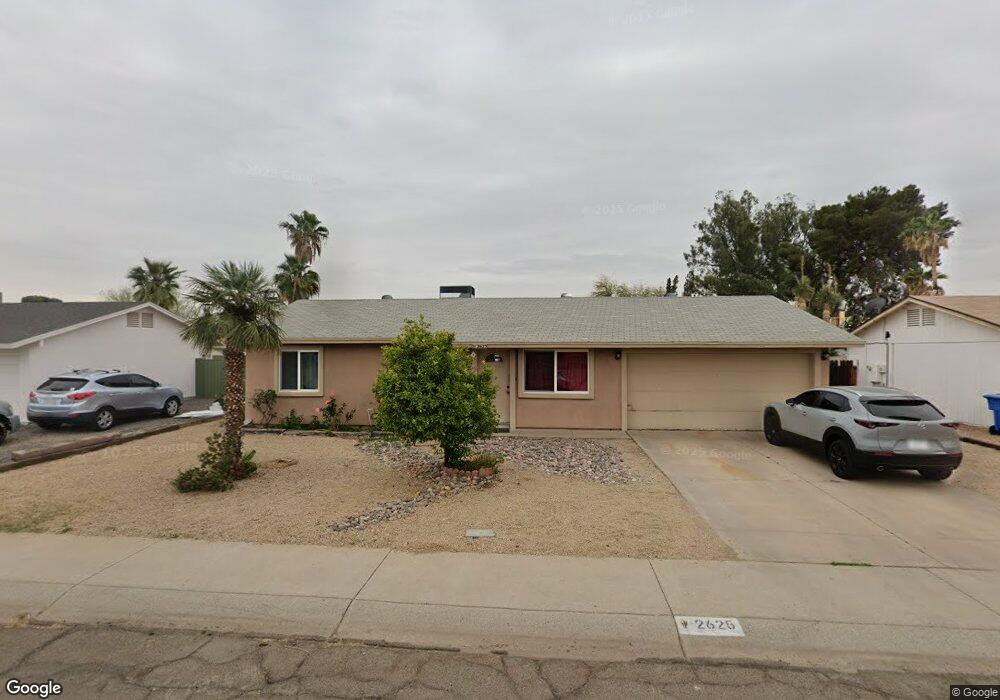
2625 E Libby St Phoenix, AZ 85032
Paradise Valley Village NeighborhoodEstimated Value: $312,093 - $375,000
3
Beds
1
Bath
1,107
Sq Ft
$310/Sq Ft
Est. Value
About This Home
This home is located at 2625 E Libby St, Phoenix, AZ 85032 and is currently estimated at $342,773, approximately $309 per square foot. 2625 E Libby St is a home located in Maricopa County with nearby schools including Campo Bello Elementary School, Greenway Middle School, and North Canyon High School.
Ownership History
Date
Name
Owned For
Owner Type
Purchase Details
Closed on
Apr 11, 2019
Sold by
Zapata Roy and Zapata Carmen
Bought by
Zapata Roy and Zapata Carmen
Current Estimated Value
Home Financials for this Owner
Home Financials are based on the most recent Mortgage that was taken out on this home.
Original Mortgage
$75,000
Outstanding Balance
$65,938
Interest Rate
4.3%
Mortgage Type
Credit Line Revolving
Estimated Equity
$276,835
Purchase Details
Closed on
May 23, 2003
Sold by
Zapata Carmen
Bought by
Zapata Roy
Home Financials for this Owner
Home Financials are based on the most recent Mortgage that was taken out on this home.
Original Mortgage
$110,888
Interest Rate
5.61%
Mortgage Type
FHA
Purchase Details
Closed on
Oct 25, 1999
Sold by
Sharp Vickie A
Bought by
Weyant Scott Allen and Weyant Anna Diedra
Home Financials for this Owner
Home Financials are based on the most recent Mortgage that was taken out on this home.
Original Mortgage
$80,510
Interest Rate
7.82%
Mortgage Type
New Conventional
Create a Home Valuation Report for This Property
The Home Valuation Report is an in-depth analysis detailing your home's value as well as a comparison with similar homes in the area
Home Values in the Area
Average Home Value in this Area
Purchase History
| Date | Buyer | Sale Price | Title Company |
|---|---|---|---|
| Zapata Roy | -- | None Available | |
| Zapata Roy | -- | Security Title Agency | |
| Zapata Roy | $115,000 | Security Title Agency | |
| Weyant Anna Diedra | -- | Security Title Agency | |
| Weyant Scott Allen | $83,000 | First American Title |
Source: Public Records
Mortgage History
| Date | Status | Borrower | Loan Amount |
|---|---|---|---|
| Open | Zapata Roy | $75,000 | |
| Closed | Zapata Roy | $110,888 | |
| Previous Owner | Weyant Scott Allen | $80,510 |
Source: Public Records
Tax History
| Year | Tax Paid | Tax Assessment Tax Assessment Total Assessment is a certain percentage of the fair market value that is determined by local assessors to be the total taxable value of land and additions on the property. | Land | Improvement |
|---|---|---|---|---|
| 2025 | $945 | $10,912 | -- | -- |
| 2024 | $900 | $10,392 | -- | -- |
| 2023 | $900 | $23,970 | $4,790 | $19,180 |
| 2022 | $891 | $18,350 | $3,670 | $14,680 |
| 2021 | $906 | $16,260 | $3,250 | $13,010 |
| 2020 | $875 | $15,010 | $3,000 | $12,010 |
| 2019 | $879 | $13,330 | $2,660 | $10,670 |
| 2018 | $847 | $11,630 | $2,320 | $9,310 |
| 2017 | $809 | $10,760 | $2,150 | $8,610 |
| 2016 | $796 | $10,550 | $2,110 | $8,440 |
| 2015 | $738 | $8,480 | $1,690 | $6,790 |
Source: Public Records
Map
Nearby Homes
- 2507 E Libby St
- 2647 E Contention Mine Rd
- 2420 E John Cabot Rd
- 2718 E Campo Bello Dr
- 2523 E Contention Mine Rd Unit 9
- 2523 E Contention Mine Rd Unit 41
- 2827 E Angela Dr Unit 86
- 2530 E Wagoner Rd
- 17365 N Cave Creek Rd Unit 124
- 2535 E Villa Theresa Dr
- 18202 N Cave Creek Rd Unit 245
- 18202 N Cave Creek Rd Unit 151
- 18202 N Cave Creek Rd Unit 17units
- 18202 N Cave Creek Rd Unit 129
- 18202 N Cave Creek Rd Unit 5 units
- 18202 N Cave Creek Rd Unit 241
- 18202 N Cave Creek Rd Unit 157
- 18202 N Cave Creek Rd Unit 256
- 18202 N Cave Creek Rd Unit 249
- 18202 N Cave Creek Rd Unit 111
- 2631 E Libby St
- 2619 E Libby St
- 2626 E Grovers Ave
- 2632 E Grovers Ave
- 2620 E Grovers Ave
- 2637 E Libby St
- 2613 E Libby St
- 2626 E Libby St
- 2632 E Libby St
- 2620 E Libby St
- 2614 E Grovers Ave
- 2638 E Grovers Ave
- 2638 E Libby St
- 2607 E Libby St
- 2643 E Libby St
- 2614 E Libby St
- 2644 E Grovers Ave Unit CUTE
- 2644 E Grovers Ave
- 2608 E Grovers Ave
- 2619 E Charleston Ave
Your Personal Tour Guide
Ask me questions while you tour the home.