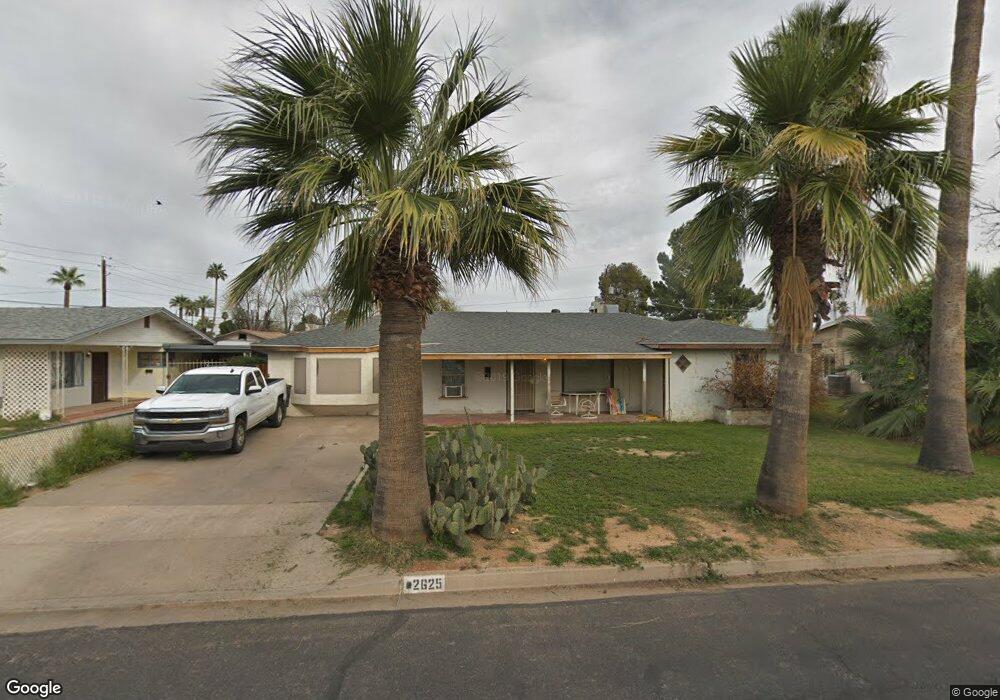
2625 N 25th Place Phoenix, AZ 85008
Camelback East Village NeighborhoodEstimated Value: $526,106 - $700,000
--
Bed
2
Baths
2,180
Sq Ft
$279/Sq Ft
Est. Value
About This Home
This home is located at 2625 N 25th Place, Phoenix, AZ 85008 and is currently estimated at $607,777, approximately $278 per square foot. 2625 N 25th Place is a home located in Maricopa County with nearby schools including Camelback High School, Phoenix Coding Academy, and Phoenix Christian School PreK - 8.
Ownership History
Date
Name
Owned For
Owner Type
Purchase Details
Closed on
Aug 24, 2022
Sold by
Marie Fischer Kim
Bought by
Stencel Veronica
Current Estimated Value
Purchase Details
Closed on
Aug 26, 2021
Sold by
Lindahl Donald A
Bought by
Stencel Veronica
Purchase Details
Closed on
Dec 1, 2014
Sold by
Fischer Robert K
Bought by
Stence Veronice
Purchase Details
Closed on
Jan 14, 2004
Sold by
Stencel Veronica M
Bought by
Fischer Robert K
Purchase Details
Closed on
Feb 4, 2003
Sold by
Fischer Robert K
Bought by
Stencel Veronica
Purchase Details
Closed on
Aug 19, 1997
Sold by
Mcdonald Bruce and Mcdonald William F
Bought by
Fischer Robert K and Lundahl Donald A
Home Financials for this Owner
Home Financials are based on the most recent Mortgage that was taken out on this home.
Original Mortgage
$68,000
Interest Rate
7.49%
Mortgage Type
New Conventional
Create a Home Valuation Report for This Property
The Home Valuation Report is an in-depth analysis detailing your home's value as well as a comparison with similar homes in the area
Home Values in the Area
Average Home Value in this Area
Purchase History
| Date | Buyer | Sale Price | Title Company |
|---|---|---|---|
| Stencel Veronica | -- | Pioneer Title | |
| Stencel Veronica | -- | Pioneer Title | |
| Stence Veronice | -- | None Available | |
| Fischer Robert K | -- | -- | |
| Stencel Veronica | -- | -- | |
| Fischer Robert K | $85,000 | Chicago Title Insurance Co |
Source: Public Records
Mortgage History
| Date | Status | Borrower | Loan Amount |
|---|---|---|---|
| Previous Owner | Fischer Robert K | $68,000 | |
| Closed | Fischer Robert K | $31,600 |
Source: Public Records
Tax History Compared to Growth
Tax History
| Year | Tax Paid | Tax Assessment Tax Assessment Total Assessment is a certain percentage of the fair market value that is determined by local assessors to be the total taxable value of land and additions on the property. | Land | Improvement |
|---|---|---|---|---|
| 2025 | $2,807 | $20,784 | -- | -- |
| 2024 | $2,671 | $19,795 | -- | -- |
| 2023 | $2,671 | $42,210 | $8,440 | $33,770 |
| 2022 | $2,566 | $30,920 | $6,180 | $24,740 |
| 2021 | $2,629 | $30,910 | $6,180 | $24,730 |
| 2020 | $2,565 | $25,380 | $5,070 | $20,310 |
| 2019 | $2,547 | $23,270 | $4,650 | $18,620 |
| 2018 | $2,494 | $19,170 | $3,830 | $15,340 |
| 2017 | $2,398 | $18,510 | $3,700 | $14,810 |
| 2016 | $1,493 | $15,880 | $3,170 | $12,710 |
| 2015 | $1,116 | $12,120 | $2,420 | $9,700 |
Source: Public Records
Map
Nearby Homes
- 2601 E Virginia Ave
- 2604 N 27th St Unit 1
- 2425 E Harvard St
- 2301 N 27th St
- 2727 E Thomas Rd Unit 9
- 2246 E Sheridan St
- 2202 N 26th Place
- 2214 N 24th Place
- 2313 E Harvard St
- 2301 E Harvard St Unit 4
- 2242 E Harvard St
- 2345 N 28th Place
- 2210 N 27th Place
- 2112 N 25th Place
- 2210 E Sheridan St Unit 16
- 2217 E Sheridan St
- 2101 N 25th Place
- 2112 N 24th Place
- 2230 E Oak St
- 2241 E Pinchot Ave Unit B3
- 2631 N 25th Place
- 2619 N 25th Place
- 2541 E Cambridge Ave
- 2617 N 25th Place
- 2620 N 26th St
- 2519 E Cambridge Ave
- 2545 E Cambridge Ave
- 2701 N 25th Place
- 2622 N 25th Place
- 2622 N Foote Dr
- 2607 N 25th Place
- 2513 E Cambridge Ave
- 2540 E Cambridge Ave
- 2705 N 25th Place
- 2524 E Cambridge Ave
- 2608 N 26th St
- 2616 N 25th Place
- 2550 E Cambridge Ave
- 2518 E Cambridge Ave
- 2507 E Cambridge Ave