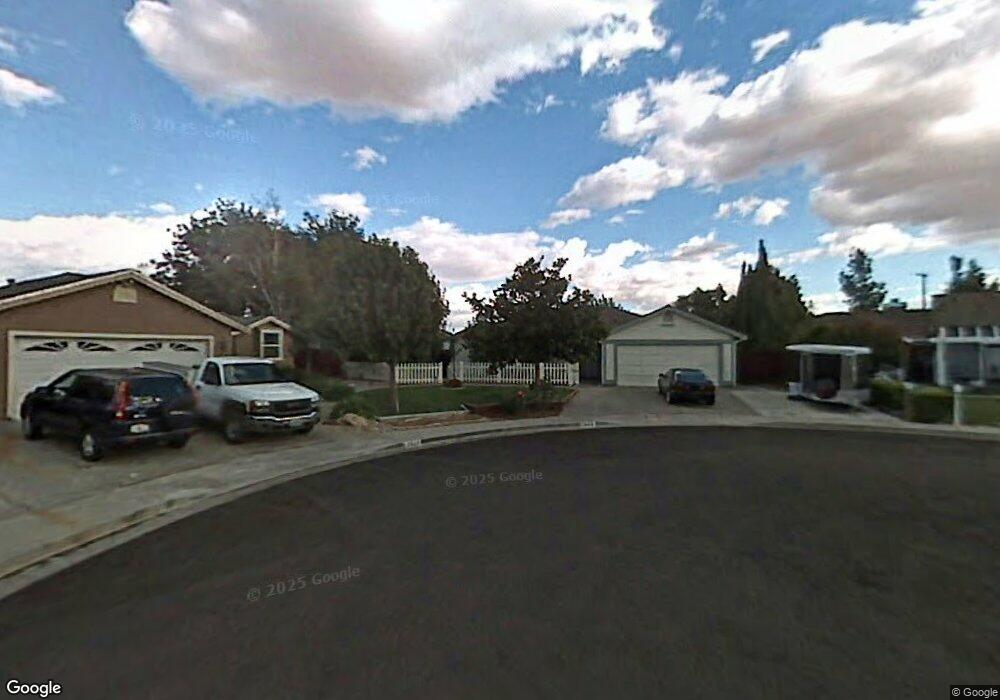
2625 Shasta Ct Fairfield, CA 94533
Estimated Value: $516,000 - $590,000
3
Beds
2
Baths
1,493
Sq Ft
$366/Sq Ft
Est. Value
About This Home
This home is located at 2625 Shasta Ct, Fairfield, CA 94533 and is currently estimated at $546,299, approximately $365 per square foot. 2625 Shasta Ct is a home located in Solano County with nearby schools including Center Elementary School, Golden West Middle School, and Vanden High School.
Ownership History
Date
Name
Owned For
Owner Type
Purchase Details
Closed on
May 10, 2004
Sold by
Jeffries Robert J and Jeffries Nancy J
Bought by
Jeffries Robert J and Jeffries Nancy J
Current Estimated Value
Home Financials for this Owner
Home Financials are based on the most recent Mortgage that was taken out on this home.
Original Mortgage
$202,000
Interest Rate
5.5%
Mortgage Type
New Conventional
Purchase Details
Closed on
Jul 6, 1997
Sold by
Kimbrough Bernard and Kimbrough Michele R
Bought by
Jeffries Robert J and Jeffries Nancy J
Home Financials for this Owner
Home Financials are based on the most recent Mortgage that was taken out on this home.
Original Mortgage
$137,598
Interest Rate
7.57%
Mortgage Type
VA
Purchase Details
Closed on
Jul 25, 1996
Sold by
Garron Linda A and Garron Wallace L
Bought by
Kimbrough Bernard and Kimbrough Michele R
Home Financials for this Owner
Home Financials are based on the most recent Mortgage that was taken out on this home.
Original Mortgage
$146,880
Interest Rate
8.32%
Mortgage Type
VA
Create a Home Valuation Report for This Property
The Home Valuation Report is an in-depth analysis detailing your home's value as well as a comparison with similar homes in the area
Home Values in the Area
Average Home Value in this Area
Purchase History
| Date | Buyer | Sale Price | Title Company |
|---|---|---|---|
| Jeffries Robert J | -- | Fidelity Title Co | |
| Jeffries Robert J | $135,000 | Placer Title Company | |
| Kimbrough Bernard | $144,000 | North American Title Co |
Source: Public Records
Mortgage History
| Date | Status | Borrower | Loan Amount |
|---|---|---|---|
| Closed | Jeffries Robert J | $202,000 | |
| Closed | Jeffries Robert J | $137,598 | |
| Previous Owner | Kimbrough Bernard | $146,880 |
Source: Public Records
Tax History Compared to Growth
Tax History
| Year | Tax Paid | Tax Assessment Tax Assessment Total Assessment is a certain percentage of the fair market value that is determined by local assessors to be the total taxable value of land and additions on the property. | Land | Improvement |
|---|---|---|---|---|
| 2025 | $2,248 | $221,643 | $63,865 | $157,778 |
| 2024 | $2,248 | $217,298 | $62,613 | $154,685 |
| 2023 | $2,206 | $213,038 | $61,386 | $151,652 |
| 2022 | $2,148 | $208,862 | $60,183 | $148,679 |
| 2021 | $2,119 | $204,767 | $59,003 | $145,764 |
| 2020 | $2,094 | $202,668 | $58,398 | $144,270 |
| 2019 | $2,055 | $198,695 | $57,253 | $141,442 |
| 2018 | $2,029 | $194,800 | $56,131 | $138,669 |
| 2017 | $1,962 | $190,981 | $55,031 | $135,950 |
| 2016 | $1,930 | $187,237 | $53,952 | $133,285 |
| 2015 | $1,845 | $179,225 | $53,142 | $126,083 |
| 2014 | $1,811 | $175,716 | $52,102 | $123,614 |
Source: Public Records
Map
Nearby Homes
- 2638 Shasta Ct
- 2600 Industrial Dr
- 198 Dobe Ln
- 40 Manchester Ln
- 2965 Cascade Cir
- 88 Manchester Dr
- 2429 Artisan Way
- 5383 Elan Dr
- 1665 Youngstown Ln
- Plan 3 at Glisten at One Lake - Glisten At One Lake
- Plan 2 at Swirl at One Lake
- Plan 1 at Glisten at One Lake - Glisten At One Lake
- Plan 2 at Glisten at One Lake - Glisten At One Lake
- Plan 4 at Swirl at One Lake
- Plan 1 at Swirl at One Lake
- Plan 3 at Swirl at One Lake
- 2438 Sheldon Dr
- 2541 Rowe Dr
- 5041 Ellis Godfrey Dr
- 5041 N Parr Ln