2626 Cherry Creek South Dr Denver, CO 80209
Belcaro NeighborhoodEstimated Value: $1,354,891 - $1,904,000
4
Beds
4
Baths
2,550
Sq Ft
$653/Sq Ft
Est. Value
About This Home
This home is located at 2626 Cherry Creek South Dr, Denver, CO 80209 and is currently estimated at $1,663,973, approximately $652 per square foot. 2626 Cherry Creek South Dr is a home located in Denver County with nearby schools including Cory Elementary School, Merrill Middle School, and South High School.
Ownership History
Date
Name
Owned For
Owner Type
Purchase Details
Closed on
Jul 19, 2005
Sold by
Balwen Investment Llc
Bought by
Qualified Personal Residence Trust Of Ju
Current Estimated Value
Purchase Details
Closed on
Jun 3, 2005
Sold by
Contino Sal and Contino Karyn
Bought by
Balwen Investment Llc
Purchase Details
Closed on
Oct 27, 2004
Sold by
Contino Sal and Contino Karyn
Bought by
Contino Sal and Contino Karyn
Purchase Details
Closed on
Apr 13, 1999
Sold by
Bcorp Polo Creek Llc
Bought by
Contino Sal and Contino Karyn
Home Financials for this Owner
Home Financials are based on the most recent Mortgage that was taken out on this home.
Original Mortgage
$258,000
Interest Rate
6.37%
Create a Home Valuation Report for This Property
The Home Valuation Report is an in-depth analysis detailing your home's value as well as a comparison with similar homes in the area
Home Values in the Area
Average Home Value in this Area
Purchase History
| Date | Buyer | Sale Price | Title Company |
|---|---|---|---|
| Qualified Personal Residence Trust Of Ju | $808,544 | Land Title Guarantee Company | |
| Balwen Investment Llc | $799,000 | Land Title Guarantee Company | |
| Contino Sal | -- | -- | |
| Contino Sal | $589,000 | First American |
Source: Public Records
Mortgage History
| Date | Status | Borrower | Loan Amount |
|---|---|---|---|
| Previous Owner | Contino Sal | $258,000 |
Source: Public Records
Tax History Compared to Growth
Tax History
| Year | Tax Paid | Tax Assessment Tax Assessment Total Assessment is a certain percentage of the fair market value that is determined by local assessors to be the total taxable value of land and additions on the property. | Land | Improvement |
|---|---|---|---|---|
| 2024 | $6,640 | $90,540 | $36,450 | $54,090 |
| 2023 | $6,496 | $90,540 | $36,450 | $54,090 |
| 2022 | $5,555 | $76,800 | $41,640 | $35,160 |
| 2021 | $5,362 | $79,010 | $42,840 | $36,170 |
| 2020 | $5,536 | $81,770 | $42,840 | $38,930 |
| 2019 | $5,381 | $81,770 | $42,840 | $38,930 |
| 2018 | $4,721 | $68,220 | $33,330 | $34,890 |
| 2017 | $4,707 | $68,220 | $33,330 | $34,890 |
| 2016 | $5,327 | $65,320 | $28,178 | $37,142 |
| 2015 | $5,103 | $65,320 | $28,178 | $37,142 |
| 2014 | $5,129 | $61,760 | $19,510 | $42,250 |
Source: Public Records
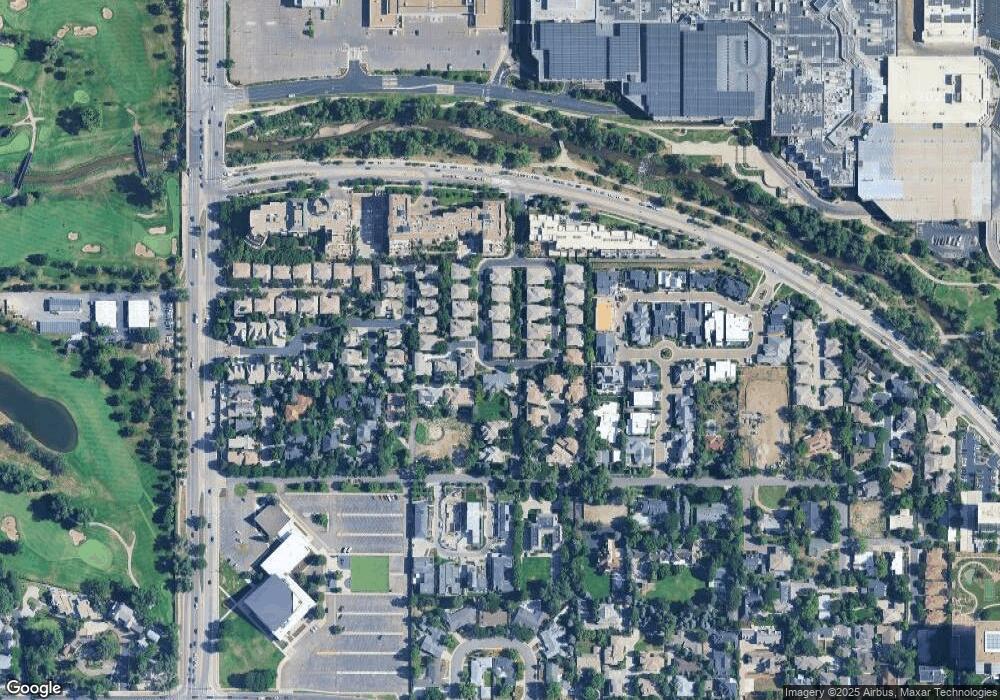
Map
Nearby Homes
- 2616 E Cherry Creek South Dr
- 2655 E Cedar Ave
- 2500 E Cherry Creek Dr S Unit 127
- 2500 E Cherry Creek Dr S Unit 414
- 2700 E Cherry Creek Dr S Unit 220
- 2700 E Cherry Creek Dr S Unit 216
- 2700 E Cherry Creek Dr S Unit 108
- 2821 E Cedar Ave Unit 2
- 2821 E Cedar Ave Unit 14
- 2417 E Cedar Ave
- 2880 E Cedar Ave
- 3000 E Cedar Ave Unit 2
- 2450 E Alameda Ave Unit 4
- 3100 E Cherry Creek Dr S Unit 307
- 3100 E Cherry Creek Dr S Unit 201
- 3131 E Alameda Ave Unit 2002
- 3131 E Alameda Ave Unit 1006
- 3131 E Alameda Ave Unit 1503
- 3131 E Alameda Ave Unit 1604
- 3131 E Alameda Ave Unit 706
- 2616 Cherry Creek South Dr
- 2616 Cherry Creek Dr S
- 2630 Cherry Creek South Dr
- 2630 E Cherry Creek Dr S
- 2693 E Cedar Ave
- 2612 Cherry Creek South Dr
- 2634 Cherry Creek South Dr
- 2634 E Cherry Creek Dr S
- 2624 Cherry Creek South Dr
- 2614 Cherry Creek South Dr
- 2638 Cherry Creek South Dr
- 2638 E Cherry Creek Dr S
- 2608 Cherry Creek South Dr
- 2610 E Cherry Creek South Dr
- 2622 E Cherry Creek Dr S
- 2622 Cherry Creek South Dr
- 2642 Cherry Creek South Dr
- 2606 Cherry Creek South Dr
- 2604 Cherry Creek South Dr
- 2606 E Cherry Creek Dr S