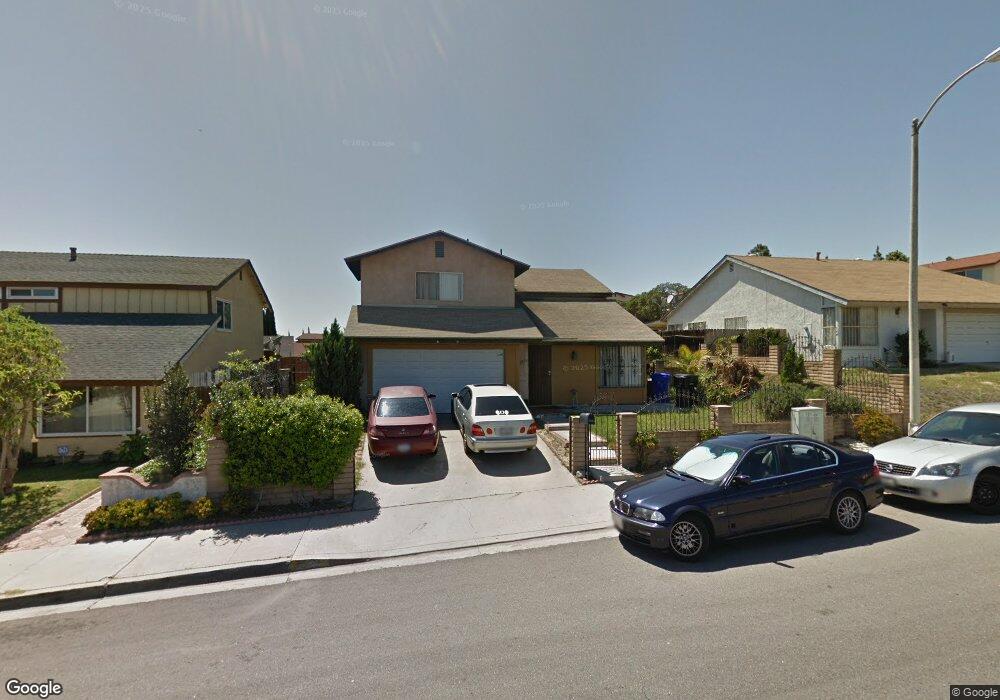
2626 Ramfos Place San Diego, CA 92139
Bay Terraces NeighborhoodEstimated Value: $776,696 - $849,000
5
Beds
3
Baths
1,663
Sq Ft
$485/Sq Ft
Est. Value
About This Home
This home is located at 2626 Ramfos Place, San Diego, CA 92139 and is currently estimated at $806,424, approximately $484 per square foot. 2626 Ramfos Place is a home located in San Diego County with nearby schools including Penn Elementary, Bell Middle School, and Morse High School.
Ownership History
Date
Name
Owned For
Owner Type
Purchase Details
Closed on
Apr 7, 2020
Sold by
Villamor Flordeluna B and Villamor Robertson A
Bought by
Villamor Flordeluna B and Villamor Robertson A
Current Estimated Value
Home Financials for this Owner
Home Financials are based on the most recent Mortgage that was taken out on this home.
Original Mortgage
$479,000
Outstanding Balance
$424,336
Interest Rate
3.4%
Mortgage Type
FHA
Estimated Equity
$382,088
Purchase Details
Closed on
Jun 12, 2017
Sold by
Manapat Angel and Manapat Maria Corazon C
Bought by
Villamor Robertson A and Villamor Flordeluna B
Home Financials for this Owner
Home Financials are based on the most recent Mortgage that was taken out on this home.
Original Mortgage
$490,943
Interest Rate
3.91%
Mortgage Type
FHA
Purchase Details
Closed on
Jul 1, 1988
Bought by
Manapat Angel V Maria C C
Create a Home Valuation Report for This Property
The Home Valuation Report is an in-depth analysis detailing your home's value as well as a comparison with similar homes in the area
Home Values in the Area
Average Home Value in this Area
Purchase History
| Date | Buyer | Sale Price | Title Company |
|---|---|---|---|
| Villamor Flordeluna B | -- | Fidelity National Title Co | |
| Villamor Robertson A | $500,000 | Corinthian Title Company | |
| Manapat Angel V Maria C C | $130,000 | -- |
Source: Public Records
Mortgage History
| Date | Status | Borrower | Loan Amount |
|---|---|---|---|
| Open | Villamor Flordeluna B | $479,000 | |
| Previous Owner | Villamor Robertson A | $490,943 |
Source: Public Records
Tax History Compared to Growth
Tax History
| Year | Tax Paid | Tax Assessment Tax Assessment Total Assessment is a certain percentage of the fair market value that is determined by local assessors to be the total taxable value of land and additions on the property. | Land | Improvement |
|---|---|---|---|---|
| 2025 | $6,885 | $568,907 | $241,814 | $327,093 |
| 2024 | $6,885 | $557,753 | $237,073 | $320,680 |
| 2023 | $6,733 | $546,818 | $232,425 | $314,393 |
| 2022 | $6,554 | $536,097 | $227,868 | $308,229 |
| 2021 | $6,509 | $525,586 | $223,400 | $302,186 |
| 2020 | $6,430 | $520,198 | $221,110 | $299,088 |
| 2019 | $6,316 | $509,999 | $216,775 | $293,224 |
| 2018 | $5,905 | $500,000 | $212,525 | $287,475 |
| 2017 | $2,741 | $231,641 | $98,459 | $133,182 |
| 2016 | $2,696 | $227,100 | $96,529 | $130,571 |
| 2015 | $2,657 | $223,690 | $95,080 | $128,610 |
| 2014 | $2,616 | $219,309 | $93,218 | $126,091 |
Source: Public Records
Map
Nearby Homes
- 6968 Appian Dr
- 7040 Tenbury Ct
- 7089 Wattle Dr
- 6872 Quebec Ct Unit 5
- 2876 Casey St Unit B
- 7479 Tooma St Unit B
- 6771 Parkside Ave
- 6759 Parkside Ave
- 6795 Parkside Ave
- 6767 Parkside Ave
- 2745 Kausman St
- 6442 Seascape Dr
- 2920 Briarwood Rd Unit B1
- 2920 Briarwood Rd
- 2920 Briarwood Rd Unit G11
- 2920 Briarwood Rd Unit C15
- 2920 Briarwood Rd Unit K13
- 6302 Clyde Ave
- 3069 Plaza Natalia
- 3020 Plaza Lorenzo
- 2636 Ramfos Place
- 2616 Ramfos Place
- 2636 Simi Ct
- 2646 Ramfos Place
- 2626 Simi Ct
- 6895 Paris Way
- 6885 Paris Way
- 2646 Simi Ct
- 2635 Ramfos Place
- 2656 Ramfos Place
- 6875 Paris Way
- 6910 Ramfos Ln
- 2645 Ramfos Place
- 2656 Simi Ct
- 2655 Ramfos Place
- 6867 Paris Way
- 6920 Ramfos Ln
- 2666 Ramfos Place
- 2631 Simi Ct
- 2605 Ramfos Place