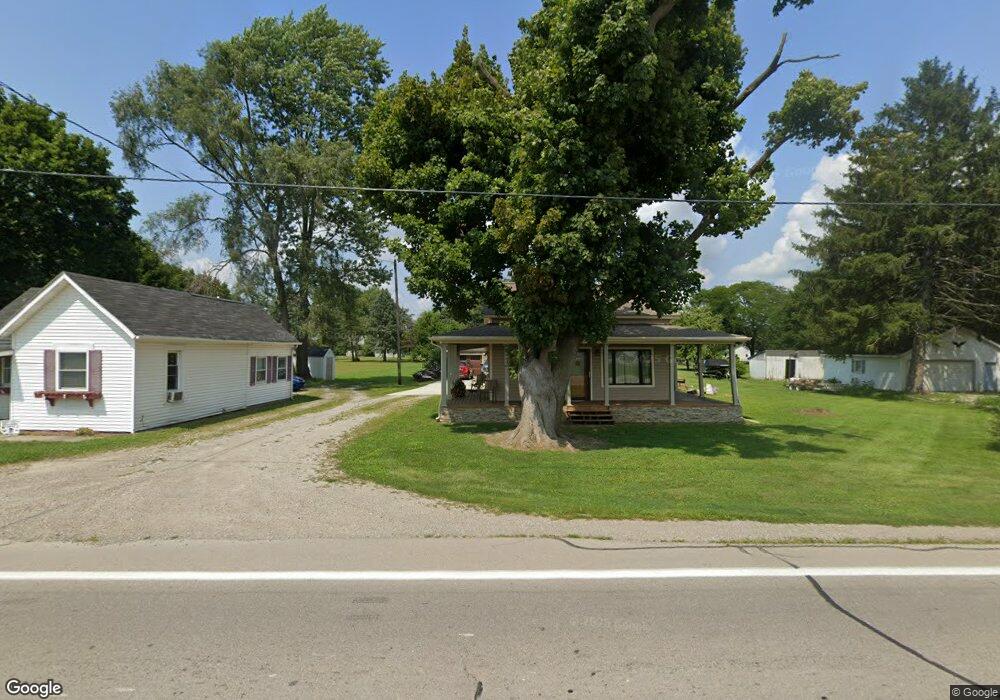
2626 Us Highway 20 Swanton, OH 43558
Estimated Value: $66,612 - $141,000
1
Bed
1
Bath
512
Sq Ft
$181/Sq Ft
Est. Value
About This Home
This home is located at 2626 Us Highway 20, Swanton, OH 43558 and is currently estimated at $92,653, approximately $180 per square foot. 2626 Us Highway 20 is a home located in Fulton County with nearby schools including Evergreen Elementary School, Evergreen Middle School, and Evergreen High School.
Ownership History
Date
Name
Owned For
Owner Type
Purchase Details
Closed on
Mar 24, 2008
Sold by
Flagstar Bank Fsb
Bought by
Jrs Rentals Llc
Current Estimated Value
Purchase Details
Closed on
Mar 8, 2007
Sold by
Stevens Larry S
Bought by
Flagstar Bank F S B
Purchase Details
Closed on
May 26, 2006
Sold by
Stevens Fred and Stevens Joyce M
Bought by
Stevens Larry S
Home Financials for this Owner
Home Financials are based on the most recent Mortgage that was taken out on this home.
Original Mortgage
$64,000
Interest Rate
6.62%
Mortgage Type
Purchase Money Mortgage
Purchase Details
Closed on
Aug 30, 2004
Sold by
Stevens Fred and Stevens Joyce M
Bought by
Stevens Fred
Purchase Details
Closed on
May 28, 2004
Sold by
Witt Jerry L
Bought by
Stevens Fred and Stevens Joyce M
Purchase Details
Closed on
Jan 1, 1990
Bought by
Witt Jerry L and Witt Jamie L
Create a Home Valuation Report for This Property
The Home Valuation Report is an in-depth analysis detailing your home's value as well as a comparison with similar homes in the area
Purchase History
| Date | Buyer | Sale Price | Title Company |
|---|---|---|---|
| Jrs Rentals Llc | $15,000 | Attorney | |
| Flagstar Bank Fsb | -- | Attorney | |
| Flagstar Bank F S B | $27,000 | Ohio Title Corporation | |
| Stevens Larry S | $80,000 | None Available | |
| Stevens Fred | -- | -- | |
| Stevens Fred | $9,000 | Agg Title | |
| Witt Jerry L | -- | -- |
Source: Public Records
Mortgage History
| Date | Status | Borrower | Loan Amount |
|---|---|---|---|
| Previous Owner | Stevens Larry S | $64,000 |
Source: Public Records
Tax History
| Year | Tax Paid | Tax Assessment Tax Assessment Total Assessment is a certain percentage of the fair market value that is determined by local assessors to be the total taxable value of land and additions on the property. | Land | Improvement |
|---|---|---|---|---|
| 2024 | $599 | $16,420 | $4,340 | $12,080 |
| 2023 | $602 | $16,420 | $4,340 | $12,080 |
| 2022 | $583 | $12,890 | $3,610 | $9,280 |
| 2021 | $571 | $12,890 | $3,610 | $9,280 |
| 2020 | $565 | $12,890 | $3,610 | $9,280 |
| 2019 | $494 | $11,490 | $3,540 | $7,950 |
| 2018 | $467 | $11,490 | $3,540 | $7,950 |
| 2017 | $461 | $11,490 | $3,540 | $7,950 |
| 2016 | $461 | $10,820 | $3,540 | $7,280 |
| 2015 | $426 | $10,820 | $3,540 | $7,280 |
| 2014 | $429 | $10,820 | $3,540 | $7,280 |
| 2013 | $297 | $7,010 | $3,680 | $3,330 |
Source: Public Records
Map
Nearby Homes
- 14046 Ohio 64
- 4481 County Rd S Unit S
- 13001 Central Ave
- 375 W Main St
- 0 County Road 4 & L
- 14917 County Road 6
- 9984 State Route 64
- 6490 County Rd N
- 5910 N Berkey Southern Rd
- 0 Waterwood Dr
- 11883 Sylvania-Metamora Rd
- 5675 Washburn Rd
- 21 Crabtree Ct
- 19 Crabtree Ct
- 16 Crabtree Ct
- 233 N Main St
- 3700 Murd Rd
- 227 Kierra Ln
- 10637 Old State Line Rd
- 3088 County Road H
- 2626 U S 20
- 2612 Us Highway 20
- 2644 Us Highway 20
- 2590 Us Highway 20
- 2662 Us Highway 20
- 2558 U S 20
- 2067 Simon Ave
- 14010 State Route 64
- 14036 State Route 64
- 14036 St Rt 64
- 2069 Simon Ave
- 14046 State Route 64
- 13962 State Route 64
- 2105 Simon Ave
- 2147 Simon Ave
- 2139 Simon Ave
- 14064 State Route 64
- 2240 U S 20
- 2161 Simon Ave
- 2071 Simon Ave
Your Personal Tour Guide
Ask me questions while you tour the home.