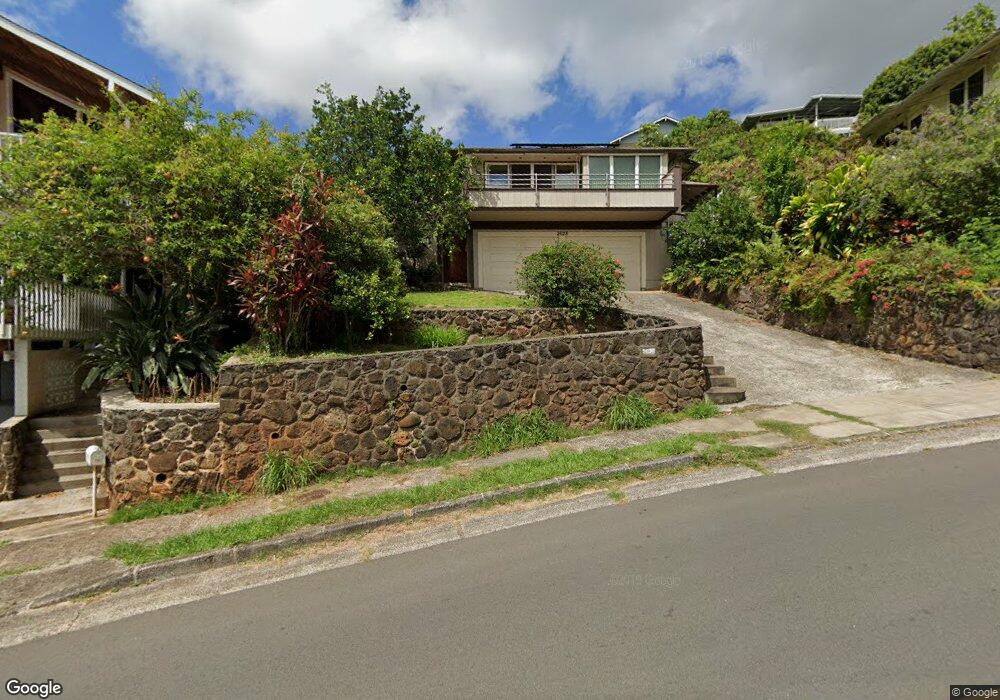
2628 Peter St Honolulu, HI 96816
Diamond Head-Kapahula-Saint Louis NeighborhoodEstimated Value: $1,221,603 - $1,673,000
4
Beds
1
Bath
1,673
Sq Ft
$860/Sq Ft
Est. Value
About This Home
This home is located at 2628 Peter St, Honolulu, HI 96816 and is currently estimated at $1,438,651, approximately $859 per square foot. 2628 Peter St is a home located in Honolulu County with nearby schools including Hokulani Elementary School, William P. Jarrett Middle School, and Kaimuki High School.
Ownership History
Date
Name
Owned For
Owner Type
Purchase Details
Closed on
Jun 13, 2025
Sold by
Inouye Keith Shigeo
Bought by
Keith S Inouye Revocable Trust and Inouye
Current Estimated Value
Purchase Details
Closed on
Aug 30, 2011
Sold by
Hieb Charles Burdette and Hieb Diane Leslie
Bought by
Inouye Keigh Shigeo
Home Financials for this Owner
Home Financials are based on the most recent Mortgage that was taken out on this home.
Original Mortgage
$520,000
Interest Rate
4.46%
Mortgage Type
New Conventional
Purchase Details
Closed on
May 25, 1999
Sold by
Umemura Robert Kaichi and Umemura Kathleen Kiyomi
Bought by
Hieb Charles Burdette and Hieb Diane Leslie
Home Financials for this Owner
Home Financials are based on the most recent Mortgage that was taken out on this home.
Original Mortgage
$332,000
Interest Rate
6.86%
Create a Home Valuation Report for This Property
The Home Valuation Report is an in-depth analysis detailing your home's value as well as a comparison with similar homes in the area
Home Values in the Area
Average Home Value in this Area
Purchase History
| Date | Buyer | Sale Price | Title Company |
|---|---|---|---|
| Keith S Inouye Revocable Trust | -- | None Listed On Document | |
| Keith S Inouye Revocable Trust | -- | None Listed On Document | |
| Inouye Keigh Shigeo | $845,000 | Title Guaranty | |
| Hieb Charles Burdette | $435,000 | -- |
Source: Public Records
Mortgage History
| Date | Status | Borrower | Loan Amount |
|---|---|---|---|
| Previous Owner | Inouye Keigh Shigeo | $520,000 | |
| Previous Owner | Hieb Charles Burdette | $332,000 |
Source: Public Records
Tax History Compared to Growth
Tax History
| Year | Tax Paid | Tax Assessment Tax Assessment Total Assessment is a certain percentage of the fair market value that is determined by local assessors to be the total taxable value of land and additions on the property. | Land | Improvement |
|---|---|---|---|---|
| 2025 | $2,867 | $1,044,700 | $933,300 | $111,400 |
| 2024 | $2,867 | $939,100 | $933,300 | $5,800 |
| 2023 | $2,695 | $969,900 | $863,300 | $106,600 |
| 2022 | $2,507 | $816,200 | $805,800 | $10,400 |
| 2021 | $2,719 | $876,900 | $793,300 | $83,600 |
| 2020 | $2,698 | $870,800 | $821,300 | $49,500 |
| 2019 | $2,922 | $914,800 | $821,300 | $93,500 |
| 2018 | $3,122 | $972,100 | $774,700 | $197,400 |
| 2017 | $3,170 | $985,700 | $737,300 | $248,400 |
| 2016 | $2,655 | $838,500 | $700,000 | $138,500 |
| 2015 | $3,078 | $959,300 | $676,700 | $282,600 |
| 2014 | $1,935 | $823,300 | $569,300 | $254,000 |
Source: Public Records
Map
Nearby Homes
- 2640 Peter St
- 1626 Quincy Place
- 2419 Saint Louis Dr
- 2407 Saint Louis Dr Unit B
- 3059 Woolsey Place
- 3063 Woolsey Place
- 2166 Palolo Ave
- 3181 Beaumont Woods Place
- 3015 Alencastre Place
- 3061 Kahaloa Dr
- 3249 Beaumont Woods Place
- 1925 Saint Louis Dr
- 1835 Saint Louis Dr
- 2281 Palolo Ave
- 2934 Woodlawn Dr
- 3031 Libert St
- 3028 Kalehua St
- 1989 9th Ave
- 1760 Palolo Ave Unit A
- 2897 Kalawao St Unit 61
- 2626 Peter St
- 1625 Quincy Place
- 1623 Quincy Place
- 1637 Quincy Place
- 2636 Peter St
- 2622 Peter St
- 2625 Peter St
- 1617 Quincy Place
- 1645 Quincy Place
- 1613 Quincy Place Unit 22D
- 1649 Quincy Place
- 2635 Peter St
- 2635 Peter St Unit B'
- 2618 Peter St
- 2615 Peter St
- 1607 Quincy Place
- 1655 Quincy Place
- 2641 Peter St
- 2644 Peter St
- 2616 Peter St