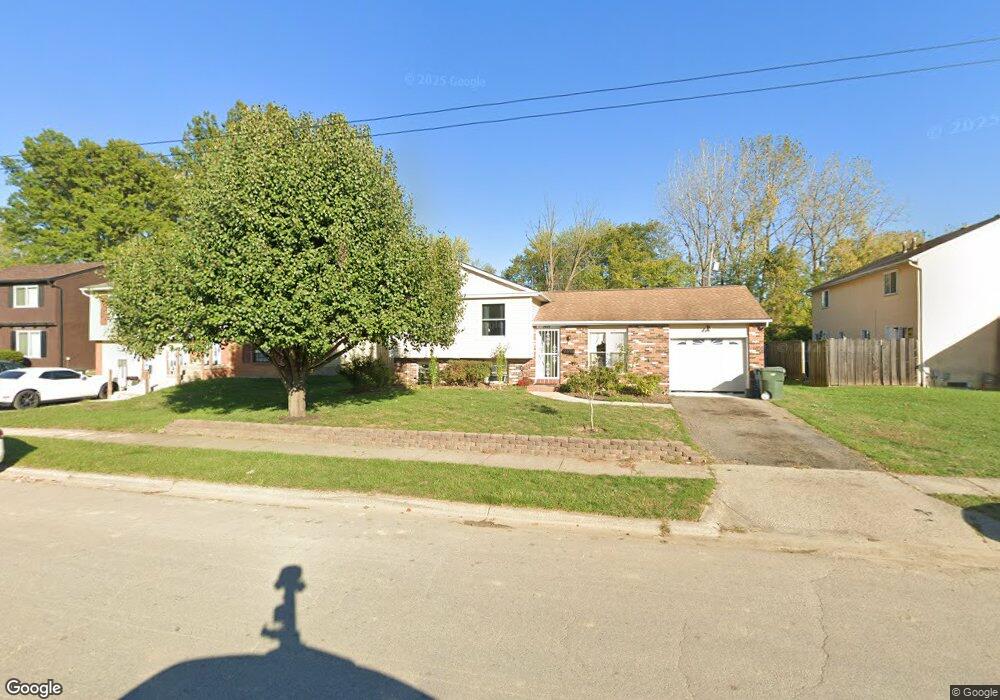
2628 Weyburn Rd Columbus, OH 43232
Glenbrook NeighborhoodEstimated Value: $165,000 - $209,167
3
Beds
2
Baths
1,284
Sq Ft
$154/Sq Ft
Est. Value
About This Home
This home is located at 2628 Weyburn Rd, Columbus, OH 43232 and is currently estimated at $197,542, approximately $153 per square foot. 2628 Weyburn Rd is a home located in Franklin County with nearby schools including Easthaven Elementary School, Yorktown Middle School, and Independence High School.
Ownership History
Date
Name
Owned For
Owner Type
Purchase Details
Closed on
Nov 20, 2006
Sold by
Mortgage Electronic Registration Systems
Bought by
Castillo Fernando Bravo and Banales Rosa Maria Botello
Current Estimated Value
Home Financials for this Owner
Home Financials are based on the most recent Mortgage that was taken out on this home.
Original Mortgage
$88,511
Interest Rate
6.24%
Mortgage Type
FHA
Purchase Details
Closed on
May 3, 2005
Sold by
Branham Gayle M and Case #04Cve08 8482
Bought by
Mortgage Electronic Registration Systems
Purchase Details
Closed on
May 31, 1994
Bought by
Branham John H and Branham Gayle M
Purchase Details
Closed on
Mar 1, 1994
Purchase Details
Closed on
Aug 29, 1990
Create a Home Valuation Report for This Property
The Home Valuation Report is an in-depth analysis detailing your home's value as well as a comparison with similar homes in the area
Home Values in the Area
Average Home Value in this Area
Purchase History
| Date | Buyer | Sale Price | Title Company |
|---|---|---|---|
| Castillo Fernando Bravo | $89,900 | Sovereign | |
| Mortgage Electronic Registration Systems | $80,252 | -- | |
| Branham John H | $67,900 | -- | |
| -- | -- | -- | |
| -- | $60,800 | -- |
Source: Public Records
Mortgage History
| Date | Status | Borrower | Loan Amount |
|---|---|---|---|
| Previous Owner | Castillo Fernando Bravo | $88,511 |
Source: Public Records
Tax History Compared to Growth
Tax History
| Year | Tax Paid | Tax Assessment Tax Assessment Total Assessment is a certain percentage of the fair market value that is determined by local assessors to be the total taxable value of land and additions on the property. | Land | Improvement |
|---|---|---|---|---|
| 2024 | $2,620 | $55,940 | $17,610 | $38,330 |
| 2023 | $2,645 | $55,930 | $17,605 | $38,325 |
| 2022 | $1,561 | $30,100 | $7,770 | $22,330 |
| 2021 | $1,564 | $30,100 | $7,770 | $22,330 |
| 2020 | $1,566 | $30,100 | $7,770 | $22,330 |
| 2019 | $1,429 | $23,560 | $6,200 | $17,360 |
| 2018 | $1,504 | $23,560 | $6,200 | $17,360 |
| 2017 | $1,428 | $23,560 | $6,200 | $17,360 |
| 2016 | $1,744 | $26,320 | $5,600 | $20,720 |
| 2015 | $1,583 | $26,320 | $5,600 | $20,720 |
| 2014 | $1,587 | $26,320 | $5,600 | $20,720 |
| 2013 | $823 | $27,685 | $5,880 | $21,805 |
Source: Public Records
Map
Nearby Homes
- 3365 Bruceton Ave
- 2275 Cardston Ct
- 3811 Bay Village St
- 2252 Meridian Ct
- 2425 Mason Village Ct Unit 2425
- 3830 Charbonnett Ct Unit 6-A
- 2472 Nassau Dr Unit 37D
- 3059 Remington Ridge Rd
- 2509 Burgandy Ln Unit 46B
- 2503 Burgandy Ln Unit 46A
- 2825 S Hampton Rd
- 3105 Wessex Ct
- 3100 Westaire Ct
- 3036 Wadsworth Ct
- 0 Wessex Ct
- 3038 Wadsworth Ct
- 3054 Wadsworth Ct
- 0 Ravenswood Ct
- 1836 Penfield Ct S
- 2971 Queensrowe Dr
- 2620 Weyburn Rd
- 3490 Weyburn Ct Unit 492
- 2612 Weyburn Rd
- 0 Westpoint Dr
- 2635 Weyburn Rd Unit 637
- 2635 Weyburn Rd Unit 2637
- 2604 Weyburn Rd
- 2621 Weyburn Rd
- 3493 Westpoint Dr
- 3491 Weyburn Ct Unit 493
- 3474 Westpoint Dr
- 2596 Weyburn Rd
- 3475 Weyburn Ct
- 3481 Westpoint Dr
- 3466 Westpoint Dr
- 3467 Weyburn Ct
- 2588 Weyburn Rd
- 3479 Westpoint Dr
- 3476 Weyburn Ct
- 3458 Westpoint Dr