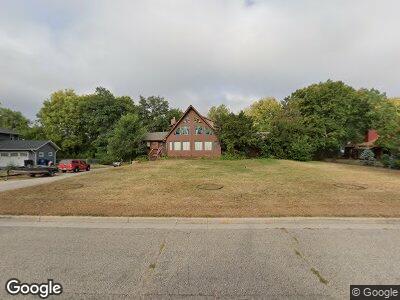
2629 Bayview Ct La Crosse, WI 54603
Estimated Value: $393,000 - $457,000
--
Bed
--
Bath
--
Sq Ft
0.48
Acres
About This Home
This home is located at 2629 Bayview Ct, La Crosse, WI 54603 and is currently estimated at $437,290. 2629 Bayview Ct is a home located in La Crosse County with nearby schools including Summit Environmental Elementary School, Logan Middle School, and Logan High School.
Ownership History
Date
Name
Owned For
Owner Type
Purchase Details
Closed on
Sep 26, 2019
Sold by
Lockhart William G
Bought by
Chrisman Thomas L and Chrisman Rachael D
Current Estimated Value
Home Financials for this Owner
Home Financials are based on the most recent Mortgage that was taken out on this home.
Original Mortgage
$135,630
Interest Rate
3.5%
Mortgage Type
New Conventional
Purchase Details
Closed on
Mar 12, 2019
Sold by
Frank G Lockhart Estate
Bought by
Lockhart William G
Purchase Details
Closed on
Oct 3, 2014
Sold by
Lockhart Frank G
Bought by
Lockhart William G and Chonko Nancy L
Purchase Details
Closed on
Jan 18, 2012
Sold by
Lockhart Frank G
Bought by
Lockhart William G
Purchase Details
Closed on
Jan 10, 2012
Sold by
Lockhart Marie J
Bought by
Lockhart Frank G
Purchase Details
Closed on
Mar 8, 2007
Sold by
Reagles Timothy J and Reagles Jacquelyn A
Bought by
Lockhart Frank G and Lockhart Marie J
Create a Home Valuation Report for This Property
The Home Valuation Report is an in-depth analysis detailing your home's value as well as a comparison with similar homes in the area
Home Values in the Area
Average Home Value in this Area
Purchase History
| Date | Buyer | Sale Price | Title Company |
|---|---|---|---|
| Chrisman Thomas L | $280,000 | None Available | |
| Lockhart William G | -- | -- | |
| Lockhart Frank G | $275,000 | None Available |
Source: Public Records
Mortgage History
| Date | Status | Borrower | Loan Amount |
|---|---|---|---|
| Open | Chrisman Thomas L | $276,000 | |
| Closed | Chrisman Thomas L | $30,000 | |
| Closed | Chrisman Thomas L | $185,000 | |
| Closed | Chrisman Thomas L | $135,630 |
Source: Public Records
Tax History Compared to Growth
Tax History
| Year | Tax Paid | Tax Assessment Tax Assessment Total Assessment is a certain percentage of the fair market value that is determined by local assessors to be the total taxable value of land and additions on the property. | Land | Improvement |
|---|---|---|---|---|
| 2023 | $5,185 | $274,200 | $34,000 | $240,200 |
| 2022 | $5,367 | $274,200 | $34,000 | $240,200 |
| 2021 | $5,445 | $274,200 | $34,000 | $240,200 |
| 2020 | $5,306 | $274,200 | $34,000 | $240,200 |
| 2019 | $5,187 | $274,200 | $34,000 | $240,200 |
| 2018 | $5,058 | $274,200 | $34,000 | $240,200 |
| 2017 | $5,023 | $274,200 | $34,000 | $240,200 |
| 2016 | $5,154 | $242,900 | $32,600 | $210,300 |
| 2015 | $5,232 | $242,900 | $32,600 | $210,300 |
| 2014 | $5,145 | $242,900 | $32,600 | $210,300 |
| 2013 | $5,537 | $242,900 | $32,600 | $210,300 |
Source: Public Records
Map
Nearby Homes
- 2811 Bayshore Dr
- 00 State Road 16 -
- 620 Plainview Rd
- 2930 Youngdale Ave
- 424 Callaway Blvd
- 422 Callaway Blvd
- 2526 1st Ave W
- 907 Lancaster St
- 2531 2nd Ave E
- 0 Tellin Ct Unit 1617248
- 0 Tellin Ct Unit 1617246
- 0 Tellin Ct Unit 1617243
- 0 Tellin Ct Unit 1617241
- 0 Tellin Ct Unit 1617240
- 1626 Lakeshore Dr
- 1041 Lauderdale N
- 1017 Lauderdale N
- 2212 Rose St
- 2217 Liberty St
- 2107 Liberty St
- 2629 Bayview Ct
- 2625 Bayview Ct
- 940 Plainview Rd
- 2630 Bayview Ct
- 2623 Bayview Ct
- 2624 Bayview Ct
- 2639 Baumgartner Dr
- 2619 Bayview Ct
- 925 Plainview Rd
- 939 Plainview Rd
- 921 Plainview Rd
- 2628 Baumgartner Dr
- 2621 Baumgartner Dr
- 2626 Baumgartner Dr
- 910 Plainview Rd
- 917 Plainview Rd
- 2624 Baumgartner Dr
- 913 Plainview Rd
- 2640 Bayshore Dr
- 2619 Thomas St