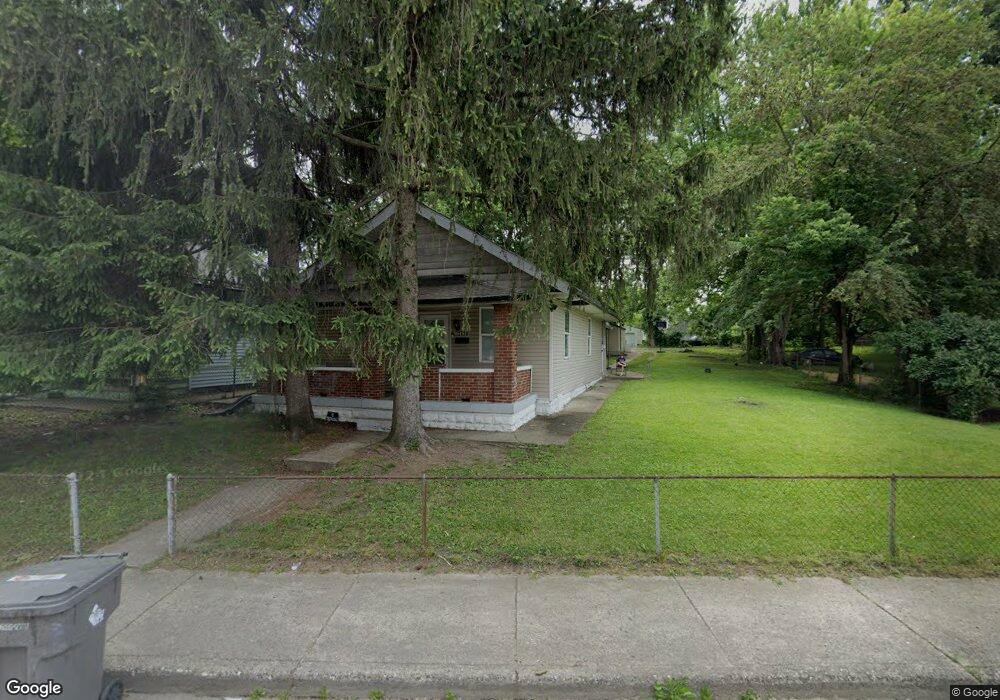
2629 Brookside Ave Indianapolis, IN 46218
Near Eastside NeighborhoodEstimated Value: $103,000 - $137,137
2
Beds
1
Bath
1,388
Sq Ft
$87/Sq Ft
Est. Value
About This Home
This home is located at 2629 Brookside Ave, Indianapolis, IN 46218 and is currently estimated at $120,534, approximately $86 per square foot. 2629 Brookside Ave is a home located in Marion County with nearby schools including Thomas D. Gregg School No. 15, Washington Irving School 14, and Brookside School 54.
Ownership History
Date
Name
Owned For
Owner Type
Purchase Details
Closed on
Jul 31, 2017
Sold by
Bennie E
Bought by
Griffin Walter F
Current Estimated Value
Home Financials for this Owner
Home Financials are based on the most recent Mortgage that was taken out on this home.
Original Mortgage
$54,985
Outstanding Balance
$47,654
Interest Rate
5.5%
Mortgage Type
FHA
Estimated Equity
$72,880
Purchase Details
Closed on
Jan 18, 2017
Sold by
Richey Devin
Bought by
Holt Bennie E
Purchase Details
Closed on
Feb 19, 2016
Sold by
Marion County Board Of Commissioners
Bought by
Richey Devin
Purchase Details
Closed on
Jan 21, 2016
Sold by
Dahl Unique
Bought by
Marion County
Purchase Details
Closed on
Aug 10, 2009
Sold by
Busey Bank
Bought by
Dahl Unique
Purchase Details
Closed on
Aug 25, 2008
Sold by
Fleck K Sean and Estate Of Jeffrey L Monday
Bought by
Busey Bank
Create a Home Valuation Report for This Property
The Home Valuation Report is an in-depth analysis detailing your home's value as well as a comparison with similar homes in the area
Home Values in the Area
Average Home Value in this Area
Purchase History
| Date | Buyer | Sale Price | Title Company |
|---|---|---|---|
| Griffin Walter F | $56,000 | -- | |
| Griffin Walter F | $56,025 | First American Title | |
| Holt Bennie E | -- | -- | |
| Richey Devin | $2,000 | None Available | |
| Marion County | $9,984 | None Available | |
| Dahl Unique | -- | None Available | |
| Busey Bank | $6,000 | None Available |
Source: Public Records
Mortgage History
| Date | Status | Borrower | Loan Amount |
|---|---|---|---|
| Open | Griffin Walter F | $54,985 |
Source: Public Records
Tax History Compared to Growth
Tax History
| Year | Tax Paid | Tax Assessment Tax Assessment Total Assessment is a certain percentage of the fair market value that is determined by local assessors to be the total taxable value of land and additions on the property. | Land | Improvement |
|---|---|---|---|---|
| 2024 | $607 | $83,800 | $3,900 | $79,900 |
| 2023 | $607 | $79,600 | $3,900 | $75,700 |
| 2022 | $789 | $89,200 | $3,900 | $85,300 |
| 2021 | $561 | $74,600 | $3,900 | $70,700 |
| 2020 | $106 | $14,700 | $2,000 | $12,700 |
| 2019 | $101 | $14,200 | $2,000 | $12,200 |
| 2018 | $93 | $13,300 | $2,000 | $11,300 |
| 2017 | $78 | $11,700 | $2,000 | $9,700 |
| 2016 | $75 | $11,700 | $2,000 | $9,700 |
| 2014 | $246 | $11,400 | $2,000 | $9,400 |
| 2013 | $256 | $11,400 | $2,000 | $9,400 |
Source: Public Records
Map
Nearby Homes
- 2626 E Brookside Ave
- 2624 E 18th St
- 2729 Massachusetts Ave
- 2102 E Brookside Ave
- 2646 E 18th St
- 1771 Roosevelt Ave
- 1929 Roosevelt Ave
- 1835 N Rural St
- 2822 E 19th St
- 2612 Brookway St
- 2646 E Brookside Ave
- 2621 Brookway St
- 2924 E 18th St
- 1618 N Rural St
- 2921 E Brookside Ave
- 2437 Coyner Ave
- 2934 E Brookside Ave
- 2020 Valley Ave
- 2820 E 16th St
- 2221 Langley Ave
- 2633 Brookside Ave
- 2633 E Brookside Ave
- 2639 Brookside Ave
- 2639 E Brookside Ave
- 2619 Brookside Ave
- 2615 Brookside Ave
- 2609 Brookside Ave
- 2645 Brookside Ave
- 2618 Brookside Ave
- 2649 Brookside Ave
- 2548 E 18th St
- 2614 Brookside Ave
- 2626 Brookside Ave
- 2622 Brookside Ave
- 2544 E 18th St
- 2603 Brookside Ave
- 2653 E Brookside Ave
- 2634 E 18th St
- 2653 Brookside Ave
- 2540 E 18th St