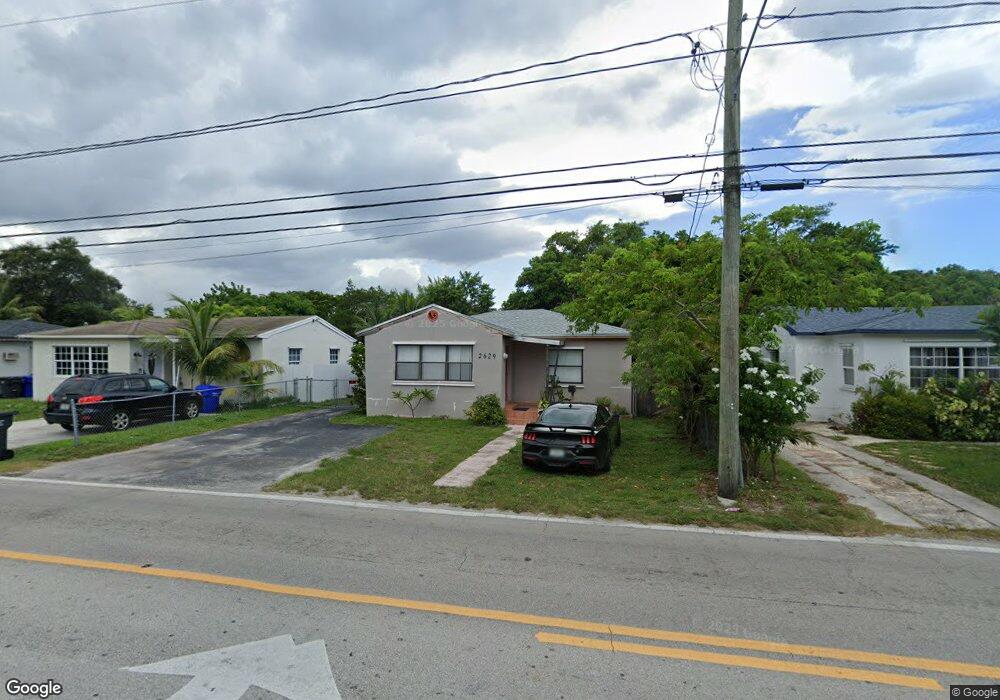
2629 Johnson St Hollywood, FL 33020
North Central Hollywood NeighborhoodEstimated Value: $352,225 - $397,000
2
Beds
1
Bath
912
Sq Ft
$413/Sq Ft
Est. Value
About This Home
This home is located at 2629 Johnson St, Hollywood, FL 33020 and is currently estimated at $376,306, approximately $412 per square foot. 2629 Johnson St is a home located in Broward County with nearby schools including Oakridge Elementary School, Olsen Middle School, and South Broward High School.
Ownership History
Date
Name
Owned For
Owner Type
Purchase Details
Closed on
Sep 16, 2002
Sold by
Montano Julio
Bought by
Morales Flor Demaria
Current Estimated Value
Purchase Details
Closed on
Aug 23, 2000
Sold by
Available Not
Bought by
Available Not
Purchase Details
Closed on
Nov 1, 1994
Sold by
Pappas Ernestine and Pappas Milton M
Bought by
Montano Julio E
Home Financials for this Owner
Home Financials are based on the most recent Mortgage that was taken out on this home.
Original Mortgage
$50,971
Interest Rate
8.62%
Mortgage Type
FHA
Create a Home Valuation Report for This Property
The Home Valuation Report is an in-depth analysis detailing your home's value as well as a comparison with similar homes in the area
Home Values in the Area
Average Home Value in this Area
Purchase History
| Date | Buyer | Sale Price | Title Company |
|---|---|---|---|
| Morales Flor Demaria | -- | -- | |
| Available Not | $25,200 | -- | |
| Montano Julio E | $51,000 | -- |
Source: Public Records
Mortgage History
| Date | Status | Borrower | Loan Amount |
|---|---|---|---|
| Previous Owner | Montano Julio E | $92,000 | |
| Previous Owner | Montano Julio E | $50,971 |
Source: Public Records
Tax History Compared to Growth
Tax History
| Year | Tax Paid | Tax Assessment Tax Assessment Total Assessment is a certain percentage of the fair market value that is determined by local assessors to be the total taxable value of land and additions on the property. | Land | Improvement |
|---|---|---|---|---|
| 2025 | $2,566 | $84,360 | -- | -- |
| 2024 | $1,104 | $81,990 | -- | -- |
| 2023 | $1,104 | $79,610 | $0 | $0 |
| 2022 | $1,025 | $77,300 | $0 | $0 |
| 2021 | $984 | $75,050 | $0 | $0 |
| 2020 | $954 | $72,150 | $0 | $0 |
| 2019 | $955 | $70,530 | $0 | $0 |
| 2018 | $926 | $69,220 | $0 | $0 |
| 2017 | $861 | $67,800 | $0 | $0 |
| 2016 | $868 | $66,410 | $0 | $0 |
| 2015 | $870 | $65,950 | $0 | $0 |
| 2014 | $875 | $65,430 | $0 | $0 |
| 2013 | -- | $64,470 | $14,540 | $49,930 |
Source: Public Records
Map
Nearby Homes
- 917 N 26th Ave
- 2548 Johnson St
- 2739 Lincoln St
- 2626 Garfield St
- 2535 Lincoln St
- 2509 Grant St
- 613 N 28th Ave
- 520 N 26th Ave
- 2525 Garfield St
- 1023 N 25th Ave
- 2635 Fillmore St
- 2511 Pierce St Unit 2
- 2703 Fillmore St
- 2609 Arthur St
- 2526 Pierce St Unit 12
- 2526 Pierce St Unit 4
- 2526 Pierce St Unit 15
- 2526 Pierce St Unit 10
- 2831 Pierce St Unit 205
- 2533 Fillmore St