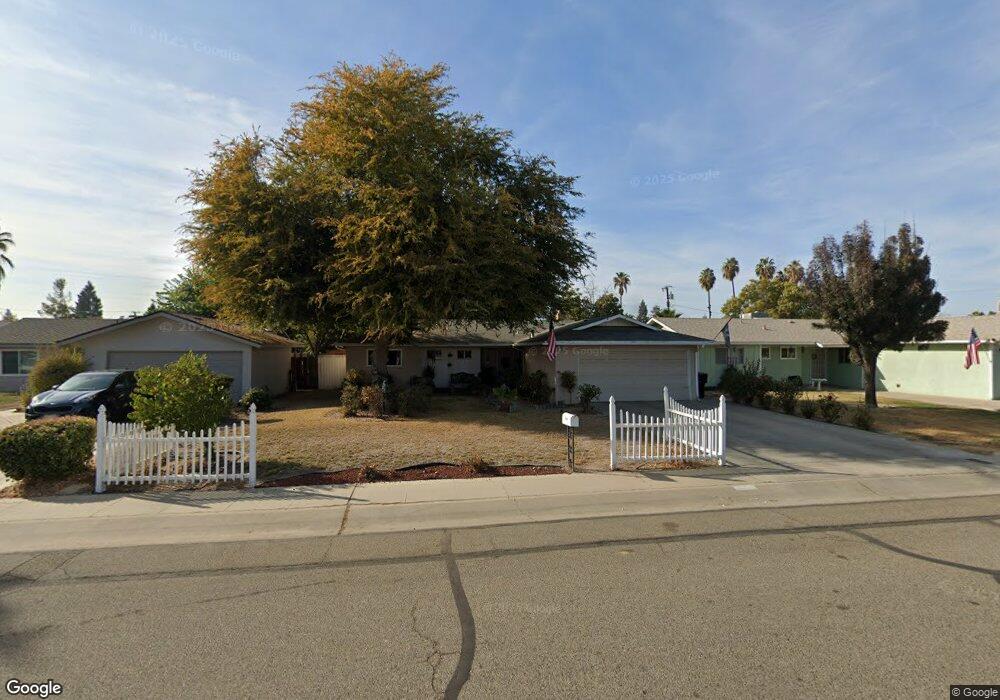
2629 S Bollinger St Visalia, CA 93277
Estimated Value: $289,508 - $317,000
3
Beds
3
Baths
1,074
Sq Ft
$283/Sq Ft
Est. Value
About This Home
This home is located at 2629 S Bollinger St, Visalia, CA 93277 and is currently estimated at $304,377, approximately $283 per square foot. 2629 S Bollinger St is a home located in Tulare County with nearby schools including Crestwood Elementary School, La Joya Middle School, and El Diamante High School.
Ownership History
Date
Name
Owned For
Owner Type
Purchase Details
Closed on
Oct 29, 2014
Sold by
Fenstermaker Revere C
Bought by
Fenstermaker Revere C and Fenstermaker Karen J
Current Estimated Value
Purchase Details
Closed on
Jun 1, 2009
Sold by
Fenstermaker Karen J
Bought by
Fenstermaker Revere C and Fenstermaker Karen J
Home Financials for this Owner
Home Financials are based on the most recent Mortgage that was taken out on this home.
Original Mortgage
$100,800
Outstanding Balance
$65,047
Interest Rate
5.25%
Mortgage Type
New Conventional
Estimated Equity
$239,330
Purchase Details
Closed on
Sep 6, 2006
Sold by
Fenstermaker Karen J
Bought by
Fenstermaker Karen J and Fenstermaker Revere C
Purchase Details
Closed on
Dec 3, 2003
Sold by
Boggs Audie G
Bought by
Boggs Audie G and Boggs Living Trust
Create a Home Valuation Report for This Property
The Home Valuation Report is an in-depth analysis detailing your home's value as well as a comparison with similar homes in the area
Home Values in the Area
Average Home Value in this Area
Purchase History
| Date | Buyer | Sale Price | Title Company |
|---|---|---|---|
| Fenstermaker Revere C | -- | None Available | |
| Fenstermaker Revere C | -- | Service Link | |
| Fenstermaker Karen J | -- | None Available | |
| Fenstermaker Karen J | -- | None Available | |
| Boggs Audie G | -- | -- |
Source: Public Records
Mortgage History
| Date | Status | Borrower | Loan Amount |
|---|---|---|---|
| Open | Fenstermaker Revere C | $100,800 |
Source: Public Records
Tax History Compared to Growth
Tax History
| Year | Tax Paid | Tax Assessment Tax Assessment Total Assessment is a certain percentage of the fair market value that is determined by local assessors to be the total taxable value of land and additions on the property. | Land | Improvement |
|---|---|---|---|---|
| 2025 | $566 | $52,689 | $9,793 | $42,896 |
| 2024 | $566 | $51,656 | $9,601 | $42,055 |
| 2023 | $551 | $50,644 | $9,413 | $41,231 |
| 2022 | $533 | $49,652 | $9,229 | $40,423 |
| 2021 | $527 | $48,678 | $9,048 | $39,630 |
| 2020 | $513 | $48,179 | $8,955 | $39,224 |
| 2019 | $508 | $47,234 | $8,779 | $38,455 |
| 2018 | $486 | $46,308 | $8,607 | $37,701 |
| 2017 | $490 | $45,400 | $8,438 | $36,962 |
| 2016 | $472 | $44,510 | $8,273 | $36,237 |
| 2015 | $458 | $43,842 | $8,149 | $35,693 |
| 2014 | $458 | $42,983 | $7,989 | $34,994 |
Source: Public Records
Map
Nearby Homes
- 4523 W Evergreen Ct
- 4633 W Cherry Ave
- 4239 W Mary Ave
- 4746 W Ashland Ave
- 3924 W Fairhaven Ave
- 2223 S Julieann St Unit 1032v
- 2346 S Julieann St Unit 1067v
- 2826 S Avocado Ct
- 3131 S Parkwood St
- 3737 W Victor Ave
- 0 S Silvervale Unit 231829
- 1633 S Chinowth St
- 3504 W Cutler Ave
- 5141 W Chestnut Ave
- 1937 S Royal Oaks Dr
- 4615 W Feemster Ave
- 3804 W Judy Ave
- 4438 W Feemster Ave
- 4301 S University St
- 4614 W Howard Ave
- 2637 S Bollinger St
- 2621 S Bollinger St
- 2647 S Bollinger St
- 2615 S Bollinger St
- 2626 S Linwood St
- 2638 S Linwood St
- 2628 S Bollinger St
- 2636 S Bollinger St
- 2620 S Bollinger St
- 2614 S Linwood St
- 4413 W Cherry Ave
- 2616 S Bollinger St
- 4328 W Country Ave
- 2711 S Bollinger St
- 2712 S Linwood St
- 4431 W Cherry Ave
- 4339 W Cherry Ave
- 4345 W Country Ave
- 2633 S Timothy Ct
- 4325 W Cherry Ave