N
Landlord's Agent in 2020
NAMARTA AHUJA
KELLER WILLIAMS EMPIRE ESTATES
Estimated Value: $883,000 - $977,000
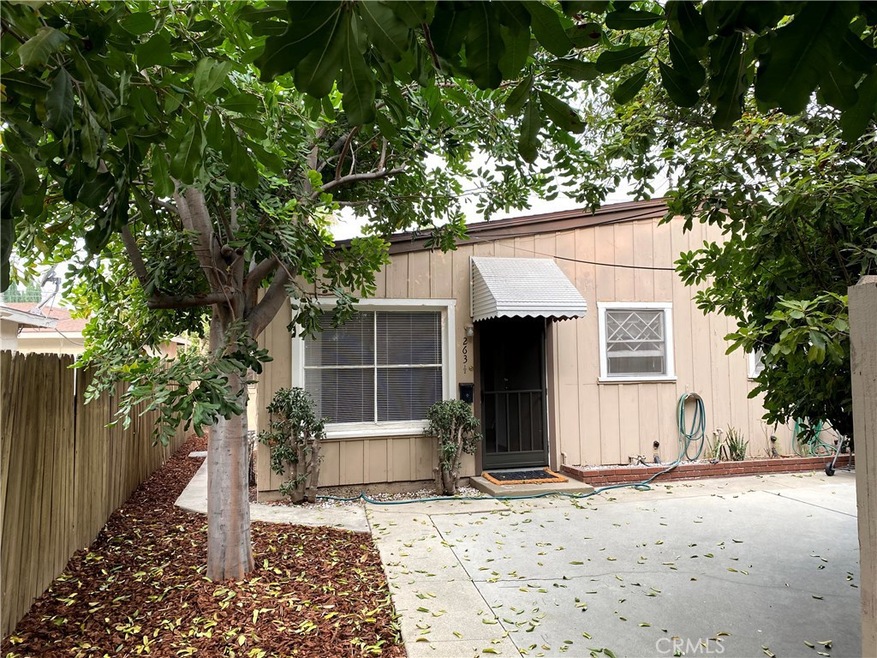
This is 1 bed, 1 bath unit with a living room and detached garage. New stove just installed. It has a laundry room with washer and drier hook ups. The detached garage is on the back side. The property is at a walking distance to downtown Upland. No Pets and No smoking is allowed please.
This property has 3 separate units on one lot. Two of the other units are tenant occupied. This available unit is in the back with separate entrance and everything. Please do not disturb the tenants from the other units and do not knock at their doors either. Thank you!
Please text your name and email to me so that I can email you the PEAD form, which you can fill up and email back to me before viewing the property. PEAD is a mandatory Covid related form. Thanks!
Last Agent to Rent the Property
NAMARTA AHUJA
KELLER WILLIAMS EMPIRE ESTATES License #01809030 Listed on: 09/30/2020
Last Renter's Agent
NAMARTA AHUJA
KELLER WILLIAMS EMPIRE ESTATES License #01809030 Listed on: 09/30/2020
| Date | Buyer | Sale Price | Title Company |
|---|---|---|---|
| Spiri Hunter | $913,000 | Stewart Title Guaranty Company | |
| Paleja Rashmin | $700,000 | Chicago Title Company | |
| Rogers Kent M | -- | Lawyers Title | |
| Rogers Alice J | -- | -- |
| Date | Status | Borrower | Loan Amount |
|---|---|---|---|
| Open | Spiri Hunter | $913,000 |
| Date | Event | Price | List to Sale | Price per Sq Ft |
|---|---|---|---|---|
| 10/18/2020 10/18/20 | Rented | $14,400 | +1100.0% | -- |
| 09/30/2020 09/30/20 | For Rent | $1,200 | +33.3% | -- |
| 01/09/2014 01/09/14 | Rented | $900 | 0.0% | -- |
| 01/09/2014 01/09/14 | For Rent | $900 | -- | -- |
| Year | Tax Paid | Tax Assessment Tax Assessment Total Assessment is a certain percentage of the fair market value that is determined by local assessors to be the total taxable value of land and additions on the property. | Land | Improvement |
|---|---|---|---|---|
| 2025 | $8,508 | $757,703 | $227,311 | $530,392 |
| 2024 | $8,314 | $742,846 | $222,854 | $519,992 |
| 2023 | $8,080 | $728,280 | $218,484 | $509,796 |
| 2022 | $7,970 | $714,000 | $214,200 | $499,800 |
| 2021 | $724 | $46,381 | $11,302 | $35,079 |
| 2020 | $710 | $45,905 | $11,186 | $34,719 |
| 2019 | $706 | $45,005 | $10,967 | $34,038 |
| 2018 | $698 | $44,123 | $10,752 | $33,371 |
| 2017 | $674 | $43,258 | $10,541 | $32,717 |
| 2016 | $468 | $42,409 | $10,334 | $32,075 |
| 2015 | $465 | $41,772 | $10,179 | $31,593 |
| 2014 | $451 | $40,954 | $9,980 | $30,974 |
N
Landlord's Agent in 2020
NAMARTA AHUJA
KELLER WILLIAMS EMPIRE ESTATES
D
Seller's Agent in 2014
Diana Arranaga
REALTY MASTERS & ASSOCIATES
Source: California Regional Multiple Listing Service (CRMLS)
MLS Number: CV20202224
APN: 1047-063-20
Disclaimer: Certain information contained herein is derived from information provided by parties other than Homes.com. All information provided is deemed reliable, but is not guaranteed to be accurate and should be independently verified.
![]() The multiple listing data appearing on this website, or contained in reports produced therefrom, is owned and copyrighted by California Regional Multiple Listing Service, Inc. ("CRMLS") and is protected by all applicable copyright laws. Information provided is for viewer's personal, non-commercial use and may not be used for any purpose other than to identify prospective properties the viewer may be interested in purchasing. All listing data, including but not limited to square footage and lot size is believed to be accurate, but the listing Agent, listing Broker and CRMLS and its affiliates do not warrant or guarantee such accuracy. The viewer should independently verify the listed data prior to making any decisions based on such information by personal inspection and/or contacting a real estate professional.
The multiple listing data appearing on this website, or contained in reports produced therefrom, is owned and copyrighted by California Regional Multiple Listing Service, Inc. ("CRMLS") and is protected by all applicable copyright laws. Information provided is for viewer's personal, non-commercial use and may not be used for any purpose other than to identify prospective properties the viewer may be interested in purchasing. All listing data, including but not limited to square footage and lot size is believed to be accurate, but the listing Agent, listing Broker and CRMLS and its affiliates do not warrant or guarantee such accuracy. The viewer should independently verify the listed data prior to making any decisions based on such information by personal inspection and/or contacting a real estate professional.
Based on information from California Regional Multiple Listing Service, Inc. and /or other sources. All data, including all measurements and calculations of area, is obtained from various sources and has not been, and will not be, verified by broker or MLS. All information should be independently reviewed and verified for accuracy. Properties may or may not be listed by the office/agent presenting the information
Ask me questions while you tour the home.
