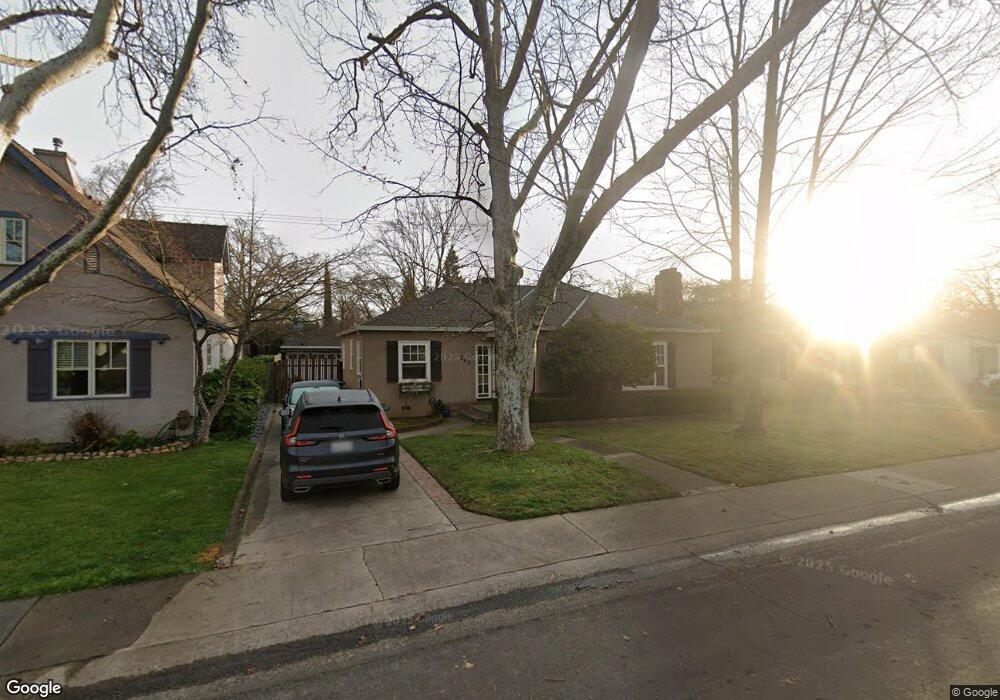
263 40th St Sacramento, CA 95819
East Sacramento NeighborhoodEstimated Value: $833,000 - $960,000
3
Beds
2
Baths
1,770
Sq Ft
$497/Sq Ft
Est. Value
About This Home
This home is located at 263 40th St, Sacramento, CA 95819 and is currently estimated at $880,356, approximately $497 per square foot. 263 40th St is a home located in Sacramento County with nearby schools including Theodore Judah Elementary, Miwok Middle School, and Hiram W. Johnson High School.
Ownership History
Date
Name
Owned For
Owner Type
Purchase Details
Closed on
Apr 29, 2019
Sold by
Cosgrove Kenneth J and Cosgrove Stacia A
Bought by
Cosgrove Kenneth J and Cosgrove Stacia A
Current Estimated Value
Purchase Details
Closed on
Feb 25, 2004
Sold by
Mcguire Mark D and Mcguire Kathryn T
Bought by
Cosgrove Kenneth J and Cosgrove Stacia A
Home Financials for this Owner
Home Financials are based on the most recent Mortgage that was taken out on this home.
Original Mortgage
$443,600
Outstanding Balance
$206,593
Interest Rate
5.62%
Mortgage Type
Purchase Money Mortgage
Estimated Equity
$673,763
Purchase Details
Closed on
Jun 16, 2000
Sold by
Walsh Esther M and Walsh James L
Bought by
Mcguire Mark D and Mcguire Kathryn T
Create a Home Valuation Report for This Property
The Home Valuation Report is an in-depth analysis detailing your home's value as well as a comparison with similar homes in the area
Home Values in the Area
Average Home Value in this Area
Purchase History
| Date | Buyer | Sale Price | Title Company |
|---|---|---|---|
| Cosgrove Kenneth J | -- | None Available | |
| Cosgrove Kenneth J | $554,500 | Commonwealth Land Title Co | |
| Mcguire Mark D | $190,000 | First American Title Ins Co |
Source: Public Records
Mortgage History
| Date | Status | Borrower | Loan Amount |
|---|---|---|---|
| Open | Cosgrove Kenneth J | $443,600 |
Source: Public Records
Tax History
| Year | Tax Paid | Tax Assessment Tax Assessment Total Assessment is a certain percentage of the fair market value that is determined by local assessors to be the total taxable value of land and additions on the property. | Land | Improvement |
|---|---|---|---|---|
| 2025 | $9,164 | $788,361 | $230,888 | $557,473 |
| 2024 | $9,164 | $772,904 | $226,361 | $546,543 |
| 2023 | $8,948 | $757,750 | $221,923 | $535,827 |
| 2022 | $8,797 | $742,893 | $217,572 | $525,321 |
| 2021 | $8,379 | $728,327 | $213,306 | $515,021 |
| 2020 | $8,451 | $720,860 | $211,119 | $509,741 |
| 2019 | $8,270 | $706,727 | $206,980 | $499,747 |
| 2018 | $8,054 | $692,871 | $202,922 | $489,949 |
| 2017 | $7,944 | $679,287 | $198,944 | $480,343 |
| 2016 | $6,798 | $581,941 | $251,974 | $329,967 |
| 2015 | $6,306 | $538,835 | $233,310 | $305,525 |
| 2014 | $6,193 | $533,500 | $231,000 | $302,500 |
Source: Public Records
Map
Nearby Homes
Your Personal Tour Guide
Ask me questions while you tour the home.