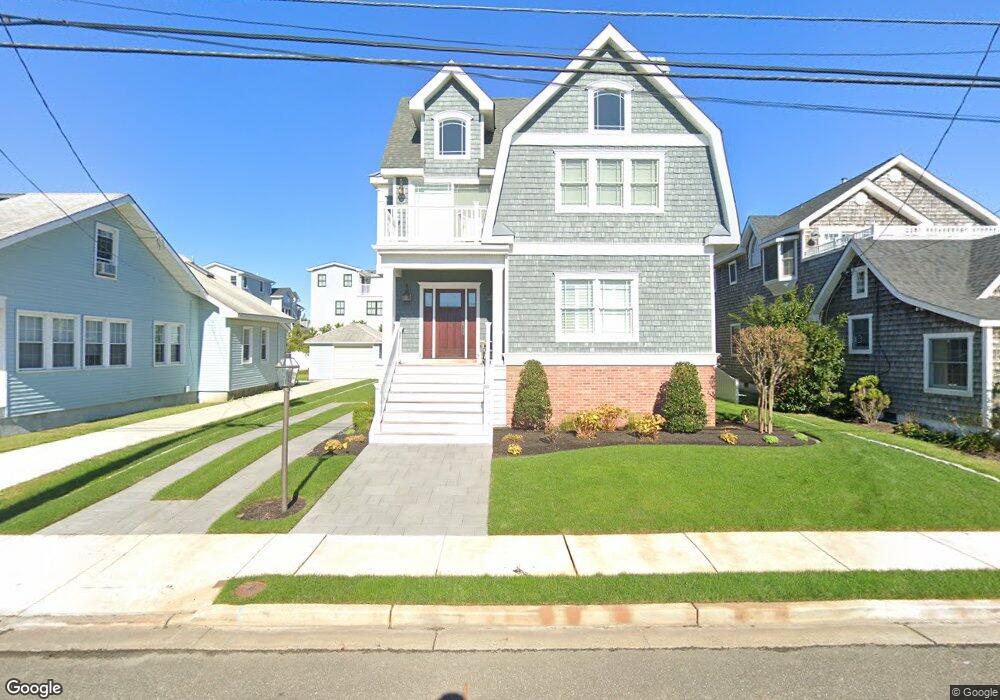
263 8th St Avalon, NJ 08202
Estimated Value: $3,233,000 - $4,694,000
--
Bed
--
Bath
3,407
Sq Ft
$1,143/Sq Ft
Est. Value
About This Home
This home is located at 263 8th St, Avalon, NJ 08202 and is currently estimated at $3,894,418, approximately $1,143 per square foot. 263 8th St is a home located in Cape May County with nearby schools including Avalon Elementary School.
Ownership History
Date
Name
Owned For
Owner Type
Purchase Details
Closed on
Aug 8, 2003
Sold by
Scali Richard B
Bought by
Morrissey Paul G
Current Estimated Value
Home Financials for this Owner
Home Financials are based on the most recent Mortgage that was taken out on this home.
Original Mortgage
$639,200
Outstanding Balance
$278,196
Interest Rate
5.46%
Estimated Equity
$3,616,222
Purchase Details
Closed on
Nov 7, 2002
Sold by
Lomobard Andrew I
Bought by
Scali Richard B and Scali Mary Jane
Home Financials for this Owner
Home Financials are based on the most recent Mortgage that was taken out on this home.
Original Mortgage
$540,000
Interest Rate
6.03%
Purchase Details
Closed on
Sep 28, 1996
Sold by
Ashworth Charlotte R
Bought by
Lombard Andrew I and Lombard Audrey Stade
Home Financials for this Owner
Home Financials are based on the most recent Mortgage that was taken out on this home.
Original Mortgage
$140,000
Interest Rate
7.9%
Create a Home Valuation Report for This Property
The Home Valuation Report is an in-depth analysis detailing your home's value as well as a comparison with similar homes in the area
Home Values in the Area
Average Home Value in this Area
Purchase History
| Date | Buyer | Sale Price | Title Company |
|---|---|---|---|
| Morrissey Paul G | $799,000 | -- | |
| Scali Richard B | $540,000 | -- | |
| Lombard Andrew I | $175,000 | -- |
Source: Public Records
Mortgage History
| Date | Status | Borrower | Loan Amount |
|---|---|---|---|
| Open | Morrissey Paul G | $639,200 | |
| Previous Owner | Scali Richard B | $540,000 | |
| Previous Owner | Lombard Andrew I | $140,000 |
Source: Public Records
Tax History Compared to Growth
Tax History
| Year | Tax Paid | Tax Assessment Tax Assessment Total Assessment is a certain percentage of the fair market value that is determined by local assessors to be the total taxable value of land and additions on the property. | Land | Improvement |
|---|---|---|---|---|
| 2025 | $10,435 | $1,699,500 | $760,000 | $939,500 |
| 2024 | $10,435 | $1,699,500 | $760,000 | $939,500 |
| 2023 | $10,350 | $1,699,500 | $760,000 | $939,500 |
| 2022 | $9,653 | $1,699,500 | $760,000 | $939,500 |
| 2021 | $9,242 | $1,699,500 | $760,000 | $939,500 |
| 2020 | $8,939 | $1,699,500 | $760,000 | $939,500 |
| 2019 | $8,667 | $1,699,500 | $760,000 | $939,500 |
| 2018 | $8,294 | $1,699,500 | $760,000 | $939,500 |
| 2017 | $8,068 | $1,451,000 | $641,300 | $809,700 |
| 2016 | $7,981 | $1,451,000 | $641,300 | $809,700 |
| 2015 | $7,850 | $1,451,000 | $641,300 | $809,700 |
| 2014 | $3,579 | $669,000 | $641,300 | $27,700 |
Source: Public Records
Map
Nearby Homes