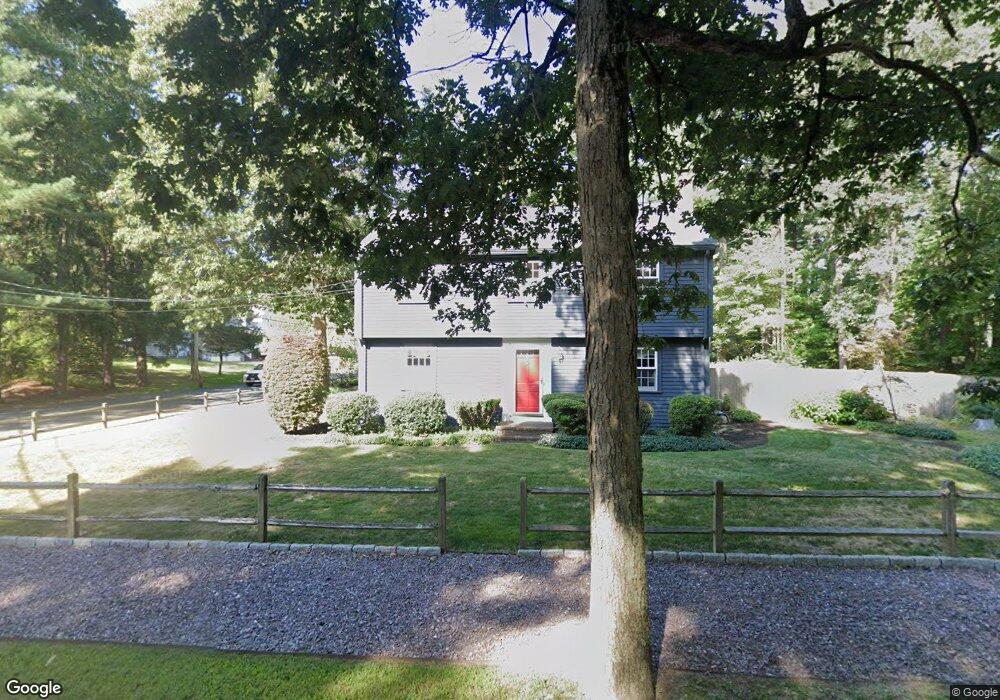
263 Cushing St Hingham, MA 02043
South Hingham NeighborhoodEstimated Value: $855,045 - $1,107,000
3
Beds
2
Baths
2,000
Sq Ft
$486/Sq Ft
Est. Value
About This Home
This home is located at 263 Cushing St, Hingham, MA 02043 and is currently estimated at $972,011, approximately $486 per square foot. 263 Cushing St is a home located in Plymouth County with nearby schools including South Elementary School, Hingham Middle School, and Hingham High School.
Ownership History
Date
Name
Owned For
Owner Type
Purchase Details
Closed on
Oct 1, 2009
Sold by
Sullivan Linda and Sullivan Stephen P
Bought by
Roberts Dianne T
Current Estimated Value
Purchase Details
Closed on
Mar 10, 2009
Sold by
Swanson Peter O
Bought by
Sullivan Linda and Sullivan Stephen P
Home Financials for this Owner
Home Financials are based on the most recent Mortgage that was taken out on this home.
Original Mortgage
$356,000
Interest Rate
5.14%
Mortgage Type
Purchase Money Mortgage
Create a Home Valuation Report for This Property
The Home Valuation Report is an in-depth analysis detailing your home's value as well as a comparison with similar homes in the area
Home Values in the Area
Average Home Value in this Area
Purchase History
| Date | Buyer | Sale Price | Title Company |
|---|---|---|---|
| Roberts Dianne T | $465,000 | -- | |
| Sullivan Linda | $280,000 | -- |
Source: Public Records
Mortgage History
| Date | Status | Borrower | Loan Amount |
|---|---|---|---|
| Previous Owner | Sullivan Linda | $356,000 |
Source: Public Records
Tax History
| Year | Tax Paid | Tax Assessment Tax Assessment Total Assessment is a certain percentage of the fair market value that is determined by local assessors to be the total taxable value of land and additions on the property. | Land | Improvement |
|---|---|---|---|---|
| 2025 | $7,290 | $681,900 | $401,900 | $280,000 |
| 2024 | $7,175 | $661,300 | $401,900 | $259,400 |
| 2023 | $6,549 | $654,900 | $401,900 | $253,000 |
| 2022 | $6,282 | $543,400 | $346,700 | $196,700 |
| 2021 | $6,292 | $533,200 | $346,700 | $186,500 |
| 2020 | $6,148 | $533,200 | $346,700 | $186,500 |
| 2019 | $6,177 | $523,000 | $346,700 | $176,300 |
| 2018 | $5,725 | $486,400 | $346,700 | $139,700 |
| 2017 | $5,761 | $470,300 | $330,800 | $139,500 |
| 2016 | $5,678 | $454,600 | $315,100 | $139,500 |
| 2015 | $5,508 | $439,600 | $300,100 | $139,500 |
Source: Public Records
Map
Nearby Homes
- 5 Old County Rd
- 2 Black Rock Dr Unit 21
- 2 Black Rock Dr
- 4 Kerri Ln
- 1 Kerri Ln
- 183 Gardner St
- 18 Whiting Ln
- 1276 Washington St Unit A
- 22 Longmeadow Rd
- 1 Hemlock Rd
- 100 Whiting St
- 14 Old Stone Way Unit 11
- 1297 Pleasant St
- 14 Cross St
- 126 Lakehurst Ave
- 9 Mast Hill Rd
- 988 Washington St Unit 6
- 32-70 Lazell St
- 17 Pine Haven Cir
- 55 Tall Oaks Dr Unit L8
- 1 Plymouth River Rd
- 3 Plymouth River Rd
- 5 Plymouth River Rd
- 253 Cushing St
- 2 Appletree Ln
- 1 Appletree Ln
- 260 Cushing St
- 7 Plymouth River Rd
- 249 Cushing St
- 9 Plymouth River Rd
- 4 Plymouth River Rd
- 291 Cushing St
- 8 Plymouth River Rd
- 11 Plymouth River Rd
- 10 Plymouth River Rd
- 295 Cushing St
- 243 Cushing St
- 15 Plymouth River Rd
- 244 Cushing St
- 8 Old County Rd
Your Personal Tour Guide
Ask me questions while you tour the home.