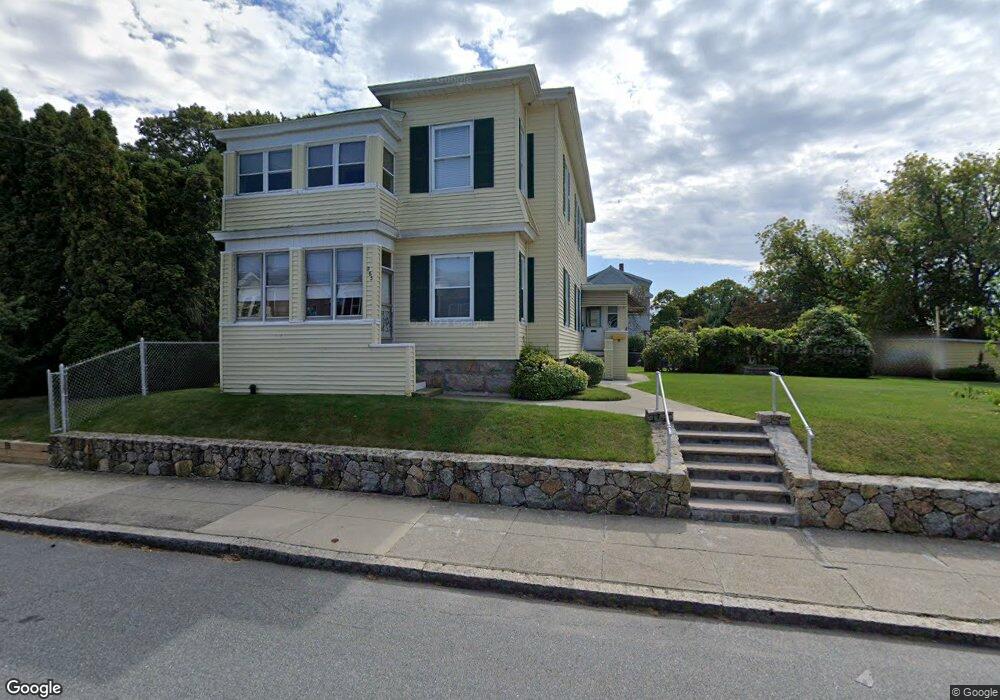
263 Field St Fall River, MA 02721
Maplewood NeighborhoodEstimated Value: $476,141 - $607,000
5
Beds
2
Baths
2,322
Sq Ft
$233/Sq Ft
Est. Value
About This Home
This home is located at 263 Field St, Fall River, MA 02721 and is currently estimated at $540,785, approximately $232 per square foot. 263 Field St is a home located in Bristol County with nearby schools including Letourneau Elementary School, Matthew J. Kuss Middle School, and B M C Durfee High School.
Ownership History
Date
Name
Owned For
Owner Type
Purchase Details
Closed on
Sep 6, 2024
Sold by
Levesque Donald N Est and Levesque
Bought by
Levesque Cynthia B
Current Estimated Value
Purchase Details
Closed on
Sep 9, 1983
Bought by
Levesque Donald N and Levesque Cynthia B
Create a Home Valuation Report for This Property
The Home Valuation Report is an in-depth analysis detailing your home's value as well as a comparison with similar homes in the area
Home Values in the Area
Average Home Value in this Area
Purchase History
| Date | Buyer | Sale Price | Title Company |
|---|---|---|---|
| Levesque Cynthia B | -- | None Available | |
| Levesque Cynthia B | -- | None Available | |
| Levesque Donald N | -- | -- |
Source: Public Records
Mortgage History
| Date | Status | Borrower | Loan Amount |
|---|---|---|---|
| Previous Owner | Levesque Donald N | $50,000 | |
| Previous Owner | Levesque Donald N | $28,034 |
Source: Public Records
Tax History
| Year | Tax Paid | Tax Assessment Tax Assessment Total Assessment is a certain percentage of the fair market value that is determined by local assessors to be the total taxable value of land and additions on the property. | Land | Improvement |
|---|---|---|---|---|
| 2025 | $4,943 | $431,700 | $132,000 | $299,700 |
| 2024 | $4,543 | $395,400 | $127,000 | $268,400 |
| 2023 | $4,178 | $340,500 | $108,900 | $231,600 |
| 2022 | $3,849 | $305,000 | $99,000 | $206,000 |
| 2021 | $3,579 | $258,800 | $91,600 | $167,200 |
| 2020 | $3,235 | $223,900 | $87,600 | $136,300 |
| 2019 | $3,065 | $210,200 | $83,500 | $126,700 |
| 2018 | $2,851 | $195,000 | $81,900 | $113,100 |
| 2017 | $2,677 | $191,200 | $83,600 | $107,600 |
| 2016 | $2,621 | $192,300 | $87,000 | $105,300 |
| 2015 | $2,473 | $189,100 | $83,800 | $105,300 |
| 2014 | $2,536 | $201,600 | $88,200 | $113,400 |
Source: Public Records
Map
Nearby Homes
Your Personal Tour Guide
Ask me questions while you tour the home.