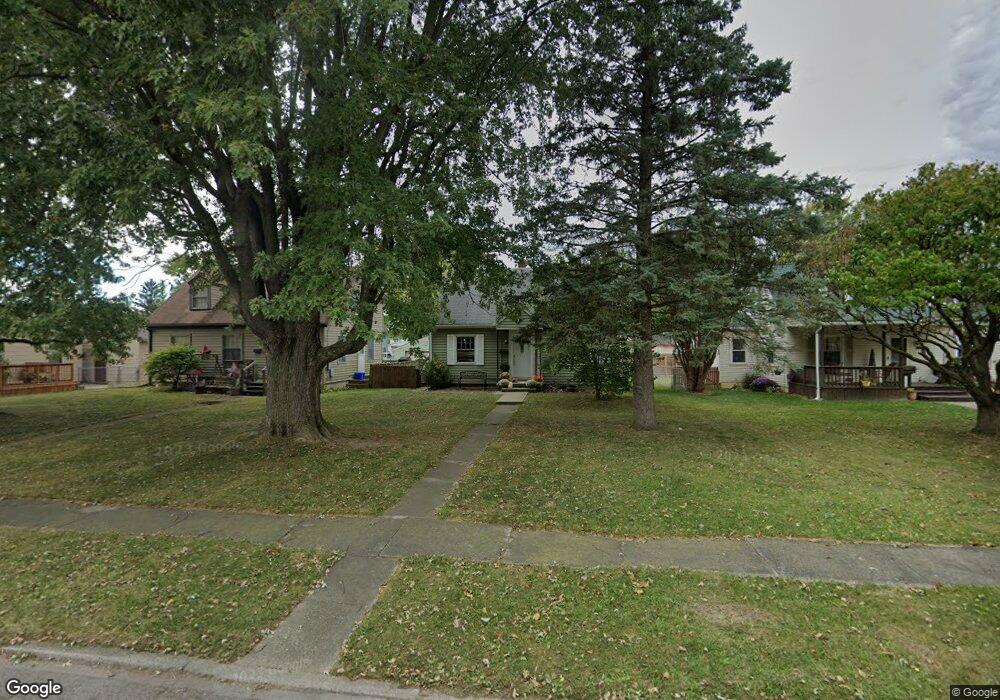
263 Johnson St Marion, OH 43302
Estimated Value: $90,000 - $127,990
2
Beds
1
Bath
720
Sq Ft
$156/Sq Ft
Est. Value
About This Home
This home is located at 263 Johnson St, Marion, OH 43302 and is currently estimated at $111,998, approximately $155 per square foot. 263 Johnson St is a home located in Marion County with nearby schools including George Washington Elementary School, Ulysses S. Grant Middle School, and Harding High School.
Ownership History
Date
Name
Owned For
Owner Type
Purchase Details
Closed on
Feb 20, 2015
Sold by
Mcclung Derrick and Mcclung Natalie
Bought by
Blevins Rebecca A
Current Estimated Value
Home Financials for this Owner
Home Financials are based on the most recent Mortgage that was taken out on this home.
Original Mortgage
$47,110
Outstanding Balance
$36,229
Interest Rate
3.87%
Mortgage Type
FHA
Estimated Equity
$75,769
Purchase Details
Closed on
Apr 2, 2013
Sold by
Mckinniss Ted M and Estate Of John F Mcclung
Bought by
Mcclung Derrick
Purchase Details
Closed on
Sep 27, 2006
Sold by
Cline Mary D and Cline Family Living Trust
Bought by
Mcclung Derrick and Mcclung John F
Home Financials for this Owner
Home Financials are based on the most recent Mortgage that was taken out on this home.
Original Mortgage
$60,000
Interest Rate
6.58%
Mortgage Type
FHA
Create a Home Valuation Report for This Property
The Home Valuation Report is an in-depth analysis detailing your home's value as well as a comparison with similar homes in the area
Home Values in the Area
Average Home Value in this Area
Purchase History
| Date | Buyer | Sale Price | Title Company |
|---|---|---|---|
| Blevins Rebecca A | $48,000 | Ct | |
| Mcclung Derrick | -- | None Available | |
| Mcclung Derrick | $58,000 | Marion Title |
Source: Public Records
Mortgage History
| Date | Status | Borrower | Loan Amount |
|---|---|---|---|
| Open | Blevins Rebecca A | $47,110 | |
| Previous Owner | Mcclung Derrick | $60,000 |
Source: Public Records
Tax History Compared to Growth
Tax History
| Year | Tax Paid | Tax Assessment Tax Assessment Total Assessment is a certain percentage of the fair market value that is determined by local assessors to be the total taxable value of land and additions on the property. | Land | Improvement |
|---|---|---|---|---|
| 2024 | $1,603 | $27,520 | $4,350 | $23,170 |
| 2023 | $1,603 | $27,520 | $4,350 | $23,170 |
| 2022 | $1,470 | $27,520 | $4,350 | $23,170 |
| 2021 | $1,337 | $21,610 | $3,780 | $17,830 |
| 2020 | $1,324 | $21,610 | $3,780 | $17,830 |
| 2019 | $1,282 | $21,610 | $3,780 | $17,830 |
| 2018 | $1,233 | $21,270 | $3,790 | $17,480 |
| 2017 | $1,144 | $21,270 | $3,790 | $17,480 |
| 2016 | $826 | $21,270 | $3,790 | $17,480 |
| 2015 | $824 | $20,760 | $3,610 | $17,150 |
| 2014 | $823 | $20,760 | $3,610 | $17,150 |
| 2012 | $814 | $20,360 | $2,660 | $17,700 |
Source: Public Records
Map
Nearby Homes
- 174 Barnhart St
- 921 Adams St
- 244 N Seffner Ave
- 357 Franconia Ave
- 1225 Ackerman Ave
- 851 E Center St
- 1090 E Church St
- 1185 E Center St
- 250 N Grand Ave
- 164 Clover Ave
- 126 S Seffner Ave
- 144 Spencer St
- 224 Jefferson St
- 699 Wilson Ave
- 310 Denning Ave
- 0 Denning Ave
- 222 Uhler Ave
- 159 Jefferson St
- 145 Sara Ave
- 1195 Indiana Ave