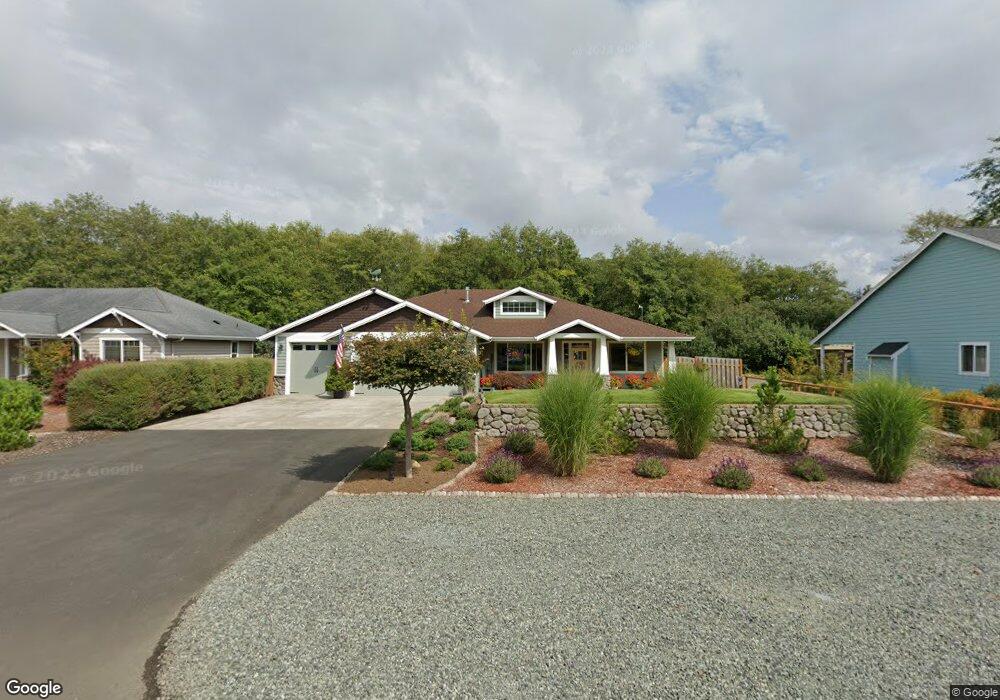
263 Kershul Cl Gearhart, OR 97138
Woodland Park NeighborhoodEstimated Value: $649,000 - $860,000
4
Beds
3
Baths
1,900
Sq Ft
$389/Sq Ft
Est. Value
About This Home
This home is located at 263 Kershul Cl, Gearhart, OR 97138 and is currently estimated at $739,482, approximately $389 per square foot. 263 Kershul Cl is a home located in Clatsop County with nearby schools including Seaside High School.
Ownership History
Date
Name
Owned For
Owner Type
Purchase Details
Closed on
Jan 22, 2025
Sold by
Sardone Frank J and Sardone Mary Jane
Bought by
Sardone Family Revocable Living Trust and Sardone
Current Estimated Value
Purchase Details
Closed on
Jan 31, 2023
Sold by
Stevenson Rosemary
Bought by
Sardone Frank J and Sardone Mary Jane
Home Financials for this Owner
Home Financials are based on the most recent Mortgage that was taken out on this home.
Original Mortgage
$393,600
Interest Rate
6.27%
Mortgage Type
New Conventional
Purchase Details
Closed on
Mar 5, 2015
Sold by
Stevenson Michael R
Bought by
Stevenson Rosemary and Stevenson Michael R
Purchase Details
Closed on
Feb 10, 2011
Sold by
Stevenson Kelly and Carman Kelly
Bought by
Stevenson Michael
Purchase Details
Closed on
Feb 22, 2008
Sold by
Ott Construction Llc
Bought by
Stevenson Michael and Stevenson Kelly
Purchase Details
Closed on
Feb 1, 2006
Sold by
Ott Construction Llc
Bought by
Martin Larry
Create a Home Valuation Report for This Property
The Home Valuation Report is an in-depth analysis detailing your home's value as well as a comparison with similar homes in the area
Home Values in the Area
Average Home Value in this Area
Purchase History
| Date | Buyer | Sale Price | Title Company |
|---|---|---|---|
| Sardone Family Revocable Living Trust | -- | None Listed On Document | |
| Sardone Frank J | $656,000 | Lawyers Title | |
| Stevenson Rosemary | -- | None Available | |
| Stevenson Michael | -- | None Available | |
| Stevenson Michael | $473,500 | Ticor Title Insurance Co | |
| Martin Larry | $179,000 | None Available |
Source: Public Records
Mortgage History
| Date | Status | Borrower | Loan Amount |
|---|---|---|---|
| Previous Owner | Sardone Frank J | $393,600 |
Source: Public Records
Tax History Compared to Growth
Tax History
| Year | Tax Paid | Tax Assessment Tax Assessment Total Assessment is a certain percentage of the fair market value that is determined by local assessors to be the total taxable value of land and additions on the property. | Land | Improvement |
|---|---|---|---|---|
| 2024 | $3,363 | $294,022 | -- | -- |
| 2023 | $3,269 | $285,460 | $0 | $0 |
| 2022 | $3,171 | $277,146 | $0 | $0 |
| 2021 | $3,237 | $269,075 | $0 | $0 |
| 2020 | $3,122 | $261,239 | $0 | $0 |
| 2019 | $3,042 | $253,631 | $0 | $0 |
| 2018 | $2,932 | $246,244 | $0 | $0 |
| 2017 | $2,854 | $239,072 | $0 | $0 |
| 2016 | $2,465 | $232,110 | $85,183 | $146,927 |
| 2015 | $2,384 | $225,350 | $82,702 | $142,648 |
| 2014 | $2,266 | $218,788 | $0 | $0 |
| 2013 | -- | $212,417 | $0 | $0 |
Source: Public Records
Map
Nearby Homes
- 263 E Kershul Cir
- 263 1weuoqtatos7 Kershul 1weuoumzl7rn
- 295 E Kershul Cir
- 323 E Kershul Cir
- 231 E Kershul Cir
- 232 E Kershul Cir
- 294 E Kershul Cir
- 371 E Kershul Cir
- 352 E Kershul Cir
- 222 E Kershul Cir
- 396 E Kershul Cir
- 0 E Kershul Cir Unit 8-1045
- 0 E Kershul Cir Unit 9-1023
- 0 E Kershul Cir Unit 15-1126
- 13 E Kershul Cir
- 25 E Kershul Cir
- 24 E Kershul Cir
- 0 E Kershul Cir Unit 8052945
- 24 E Kershul Cir Unit 24
- 0 E Kershul Cir Unit 9050337